Relative Volume and Market Leaders

In modern times, speculators often say volume is "spoofed" because of high-frequency algorithms that place massive buy or sell orders and then cancel them in milliseconds, creating a fake appearance of demand to manipulate prices without ever intending to trade.
Additionally, a huge portion of actual trading happens in "dark pools", which are basically private exchanges used by big institutions, which help them keep their massive orders hidden from the public until after they are executed.
This makes the volume on most public trading platforms charts feel like a partial or misleading picture of where the real money is moving.
My studies show that while this is true in theory, in practice, volume, when used right, can still be a great indication of accumulation prior to mark up. As a matter of fact, it can be the sign of the start of a huge massive mark up phase.
Some of the Greatest Speculators on Volume
"When volume increases on an advance, it is a sign of a healthy market; when volume increases on a decline, it indicates a weak market."
"Big movements take time to develop. It is the volume that tells you when the big force is behind the move."
"Volume is the force which indicates the amount of power behind a price movement."
"I found that a stock’s volume was like its heartbeat; a sudden increase in volume usually meant the stock was coming to life."
"Volume is your best indicator of supply and demand, and it’s the only way to tell if the big institutions are buying or selling."
"At the end of the day, the only thing that matters is price and volume; everything else is just a distraction."
Big Moves, Big Volume and Big Time
Let me start out by saying that daily charts on stocks are probably trash without higher timeframe context if you intend to speculate and capture big moves. This is probably the primary reason why technical analysis gets a bad rap.
Big moves often take time to develop and are often accompanied by big volume at the start of the cycle. In general, these moves play out over 4 to 6 quarters, and that is the minimum you should be intending to hold winners.
Why Monitor the Dailies?
While this completely contradicts what I said in the above paragraph, there is only one reason I like to monitor the dailies for;
Relative Volume
My studies show that daily Relative Volume (RVOL) are a key indicator that can help identify market leaders at the start of a cycle.If you prefer to track this data in tabular form, then monitoring the dailies won't be necessary. You can create a list of stocks that meet this criteria and then wait to execute on the weekly or monthly, whichever you prefer. Just know that the more you wait, the more price can run up. These often move quick.
Besides that, the ideal way to go about it is the higher timeframe. If you trade, I suggest positional trading using weekly, monthly and even quarterly charts (but this is just my opinion based on my personality and research). Less churn, less monitoring.
The Set-up of an Ideal Market Leader
Here is what my studies indicates an ideal market leader looks like:
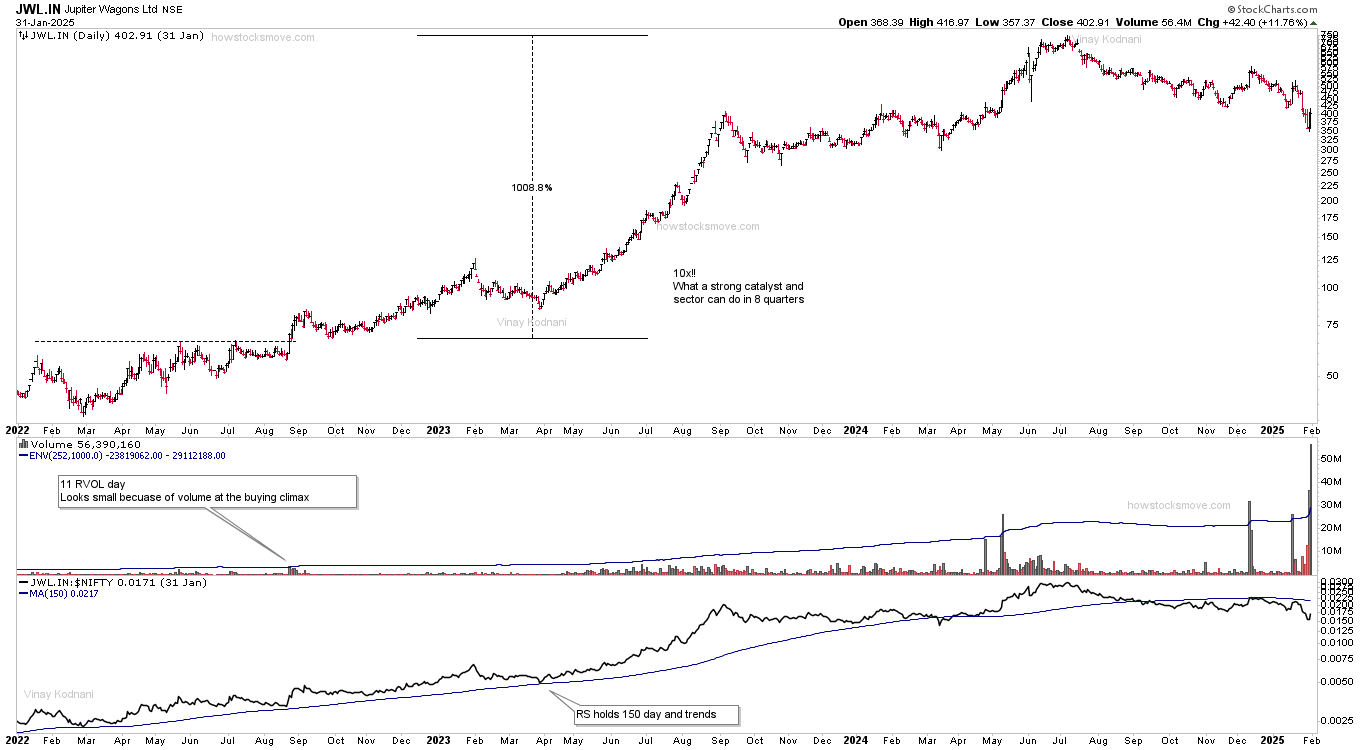
- Price breaks out to new highs (52W and ideally ATH)
- Volume is AT LEAST 10x the 252 day average (Yes, a 1000%!!!)
- The Ratio Chart (RS) is above the 150 day SMA and holds through the move
- Good Annual Sales and Profit figures are already on the table along with AT LEAST mid teens in ROE
- The stock runs up after the first market bottom and then consolidates within 30% of highs when the market creates the secondary low
- Fundamental catalyst (even if it is just a story) that gives the stock (and preferably the sector) a tailwind
Keep in mind, this is what is IDEAL.
In real life, it is rare to find all criteria met. And if you do find one, make sure to position yourself right. If this seems confusing, the chart attached below should clear up what I mean.
Example: Anand Rathi (2023) - An Ideal Market Leader
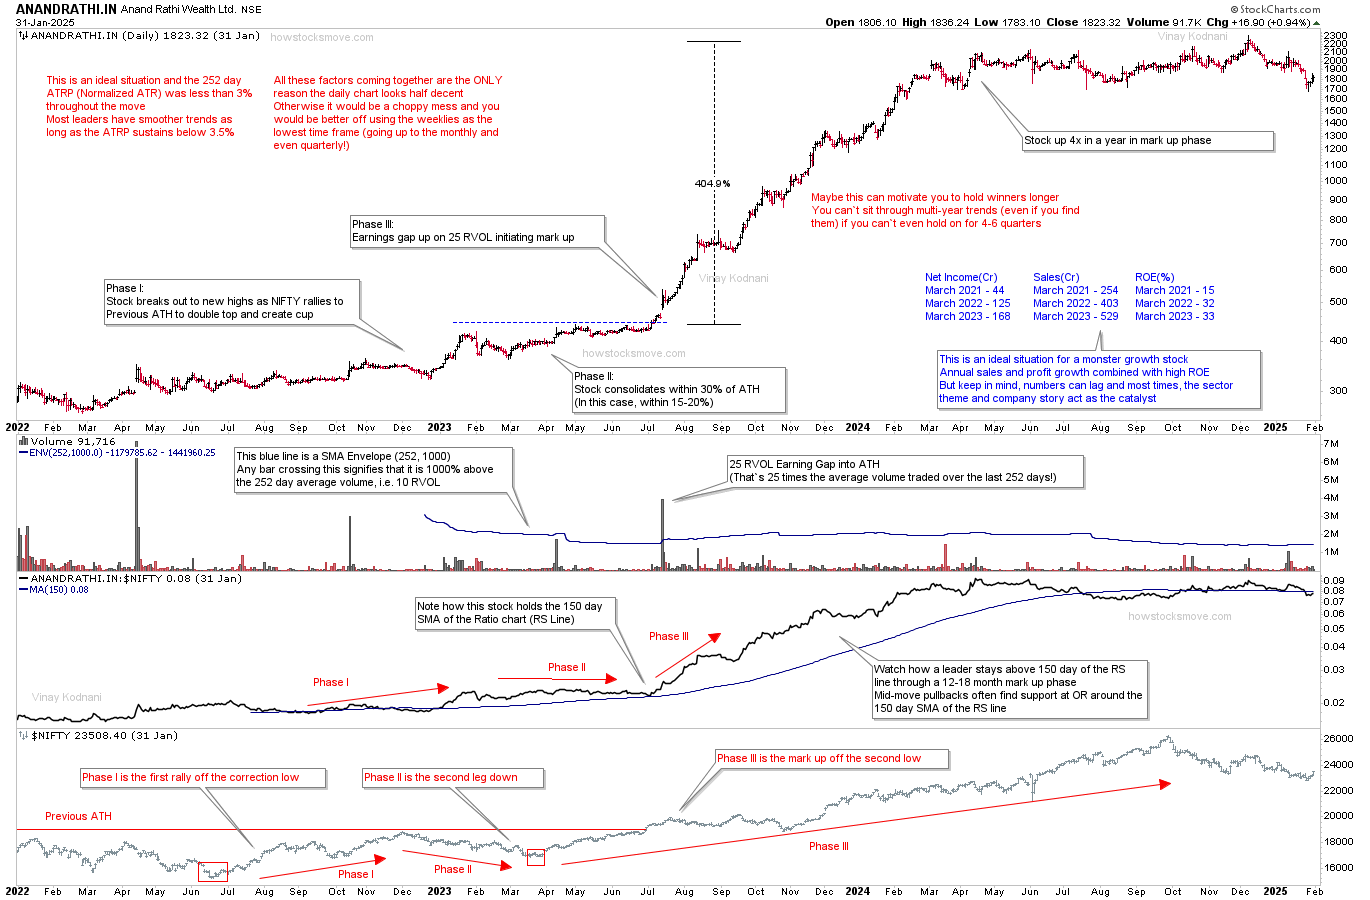
Study this. And then study it again. This is what ideal leadership looks like off a correction low.
Volume behavior at different points of the Cycle
The reason short term speculators don't trust volume is because they use tight stops, and often use volume in the same at different points of the cycle.
Imagine a mark up phase. Now apply the same logic you would apply to gaps, but to volume:
- Breakaway Gap - Think of this as our initial burst of volume
- Continuation Gap - This is the volume that comes in after the mid-move pullback
- Exhaustion Gap - Think is the high volume that occurs in the Buying Climax
The reason speculators don't trust volume is because they use it in the same way at both, the initiation, and the exhaustion of a move.
You wouldn't do that with gaps, so you probably shouldn't with volume either. It's discretionary, but that's the edge.
A 10 RVOL breakout has different meanings when a stock is coming out of a 6-8 BASE base outperforming the index off a correction low vs when it is occurring out of a 6-12 WEEK after a 300-400% 4-6 Quarter move up.
Example: Anup Engineering (2023) - RVOL at Breakout and Exhaustion
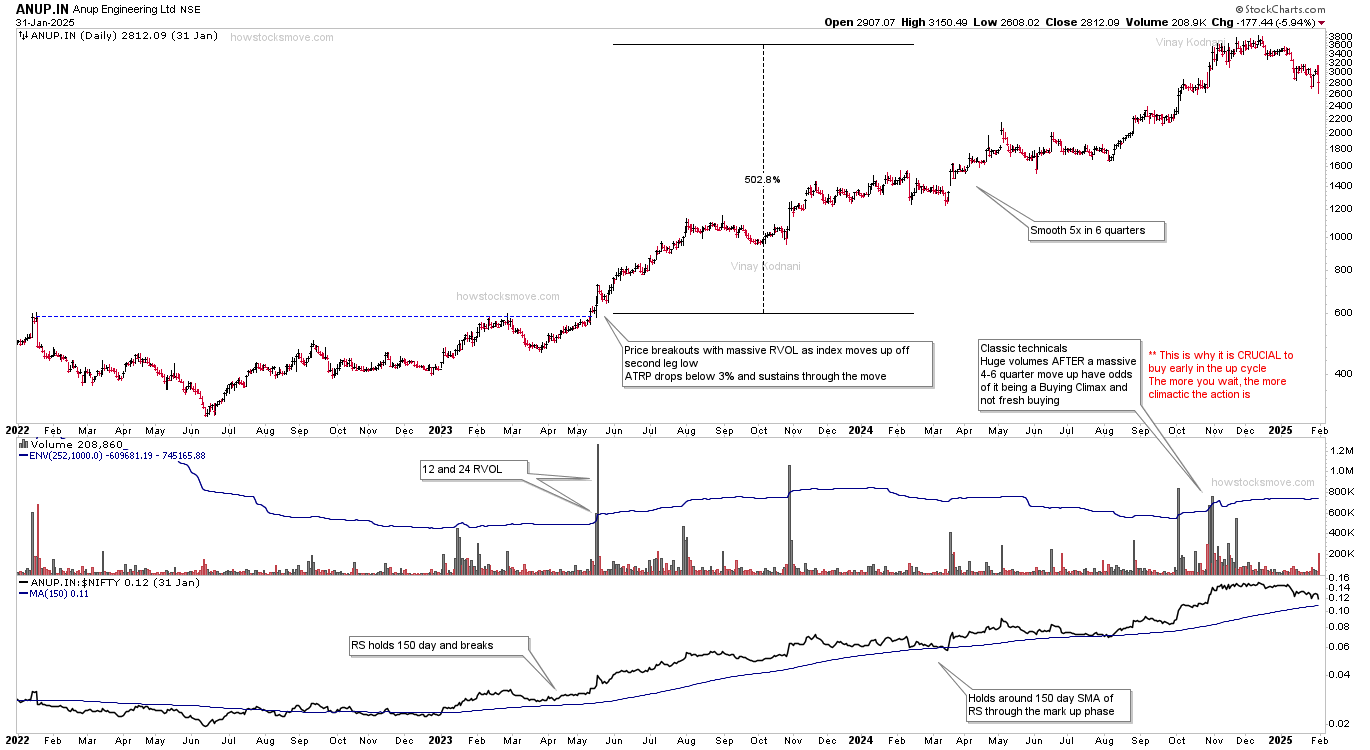
Note how the technical are similar to the prior chart. New highs on high volume and then a trend holding the 150 day SMA of the Relative Strength Line.
Volume - The More Clustered, The Better
If one or two days indicate a huge spike in demand, imagine what happens when you have multiple days of high RVOL clustered together.
Even if the stocks takes a breather to "shake out the weak hands", it should definitely be on your watchlist.
This kind of volume is the "sky-scraper action" (as it towers all the volume bars around it) which O'Neil explained with the Elephant in Bathtub analogy.
O'Neil argued that large institutions are so massive that they cannot move into or out of a stock without leaving a trace. He compared a large institution buying a stock to an elephant trying to get into a bathtub full of water.
- The Elephant: Represents a massive institutional buy order
- The Bathtub: Represents the "float" or the total number of shares available to trade.
- The Water Level: Represents the stock price and volume.
According to my studies, most leaders that run up hundreds of percent usually have clusters of high RVOL days (primarily why I recommend daily data for this set-up) at ignition of the move as institutions or big speculators pile in to the stock once they have a catalyst in place.
Example: Cupid (2023) - Clustered RVOL Days at Breakout
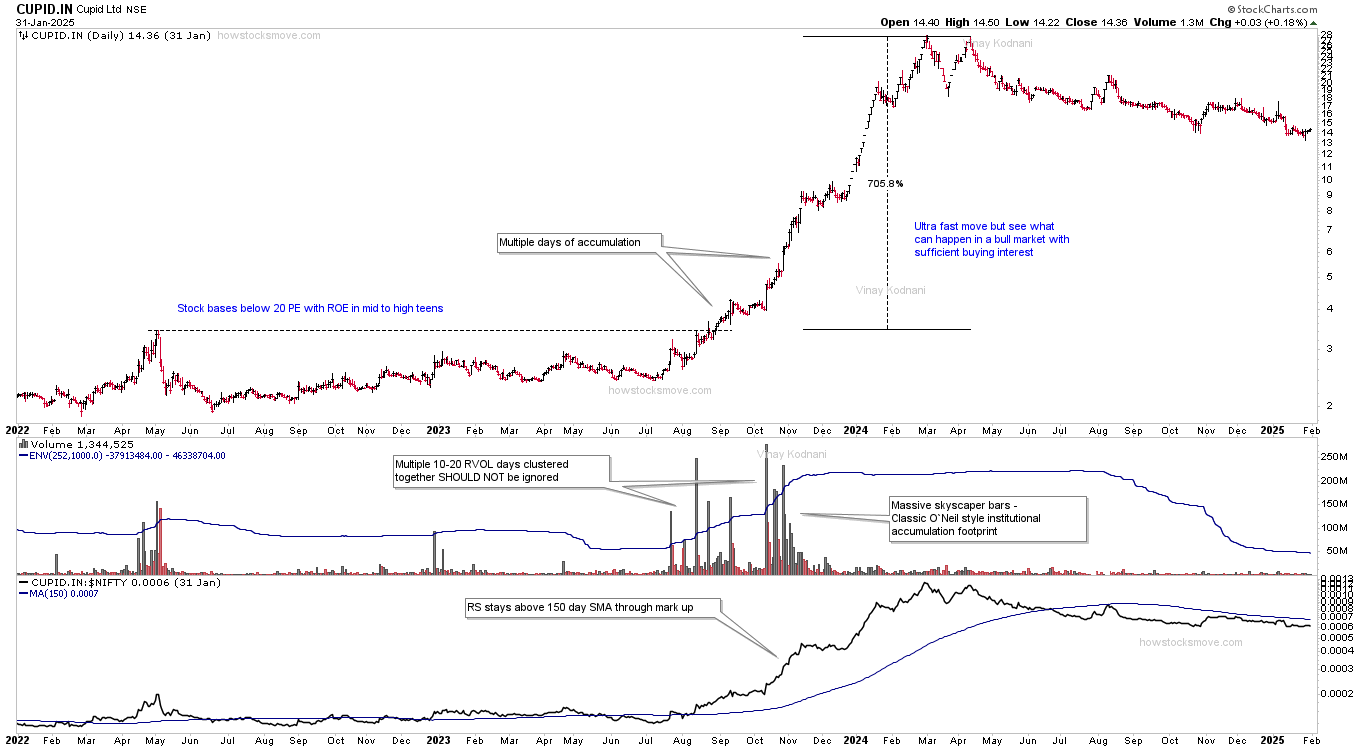
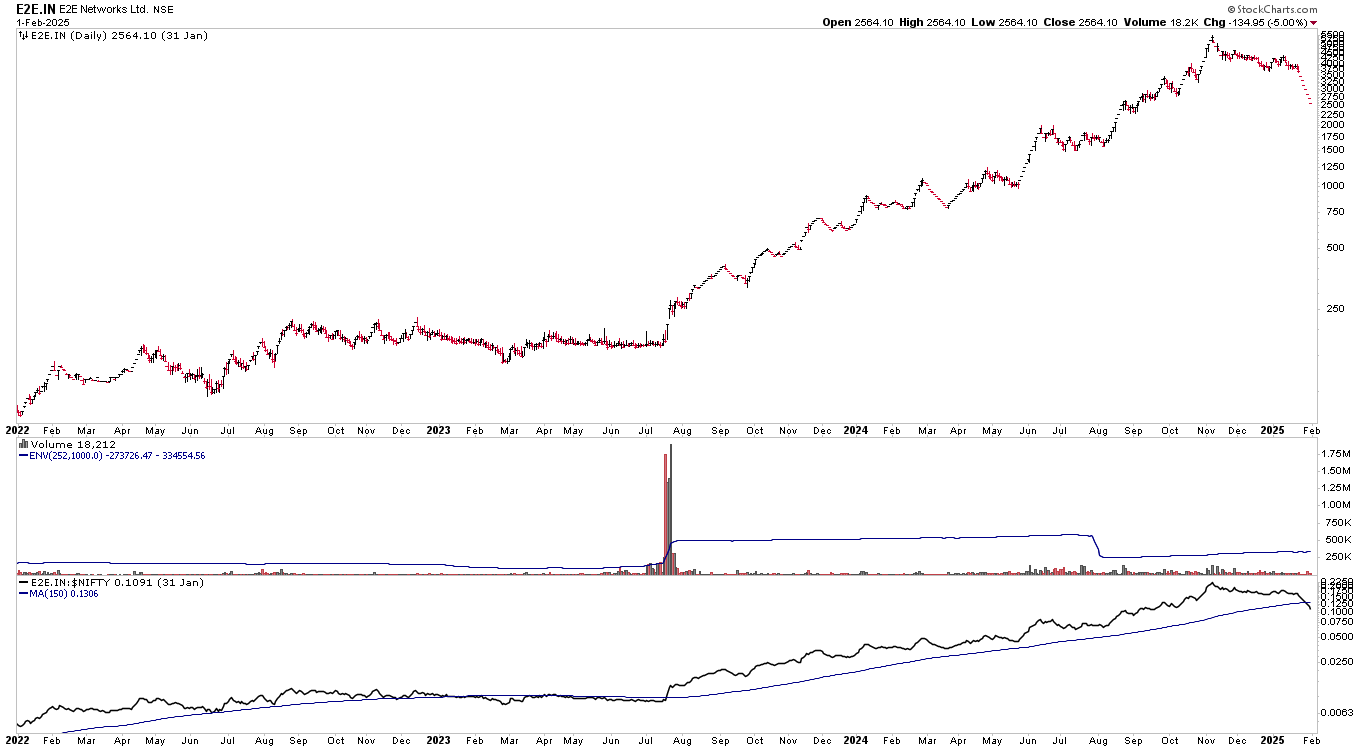
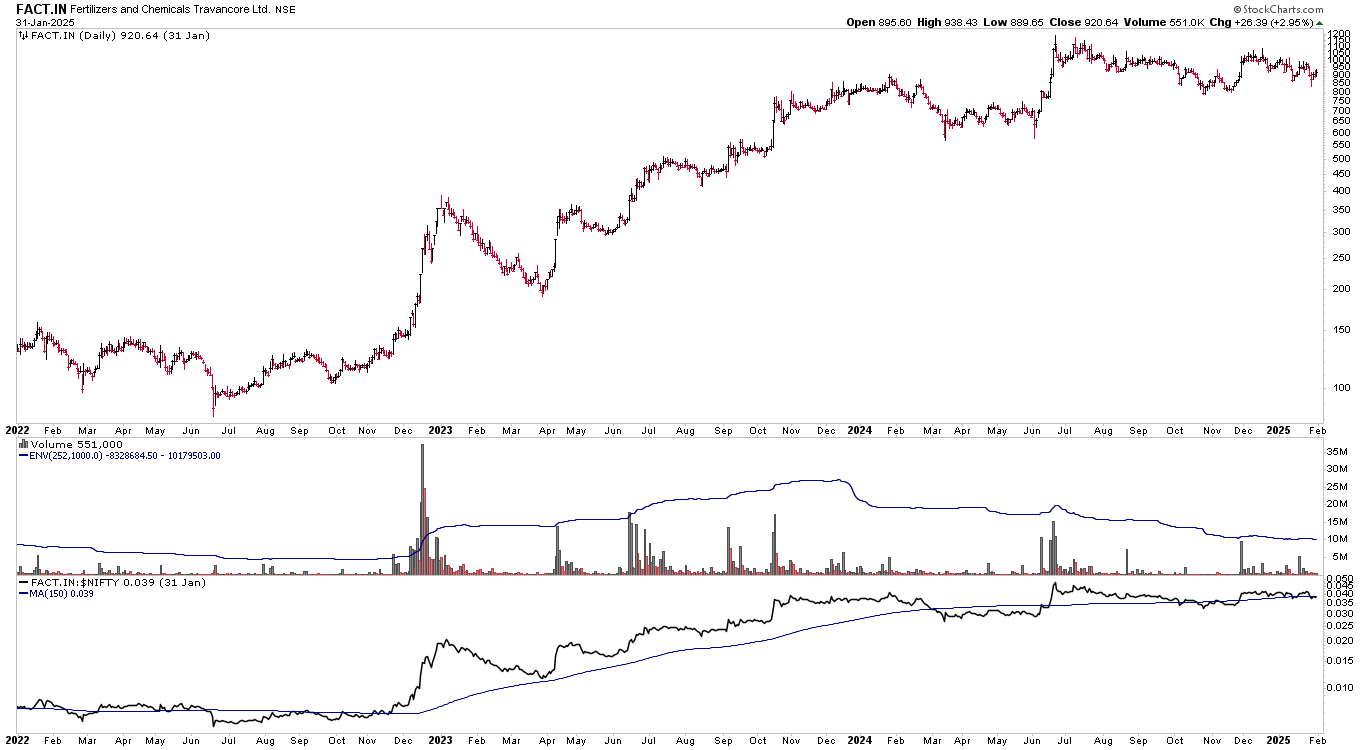
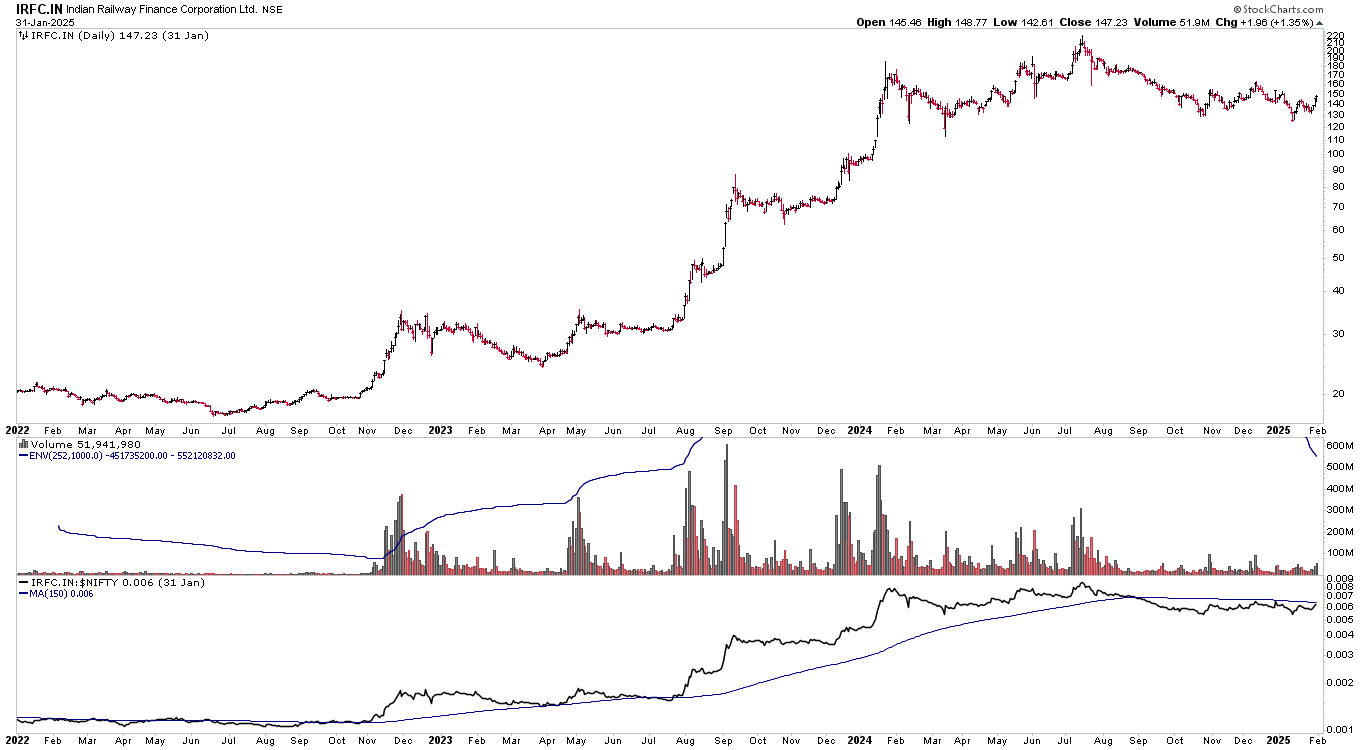
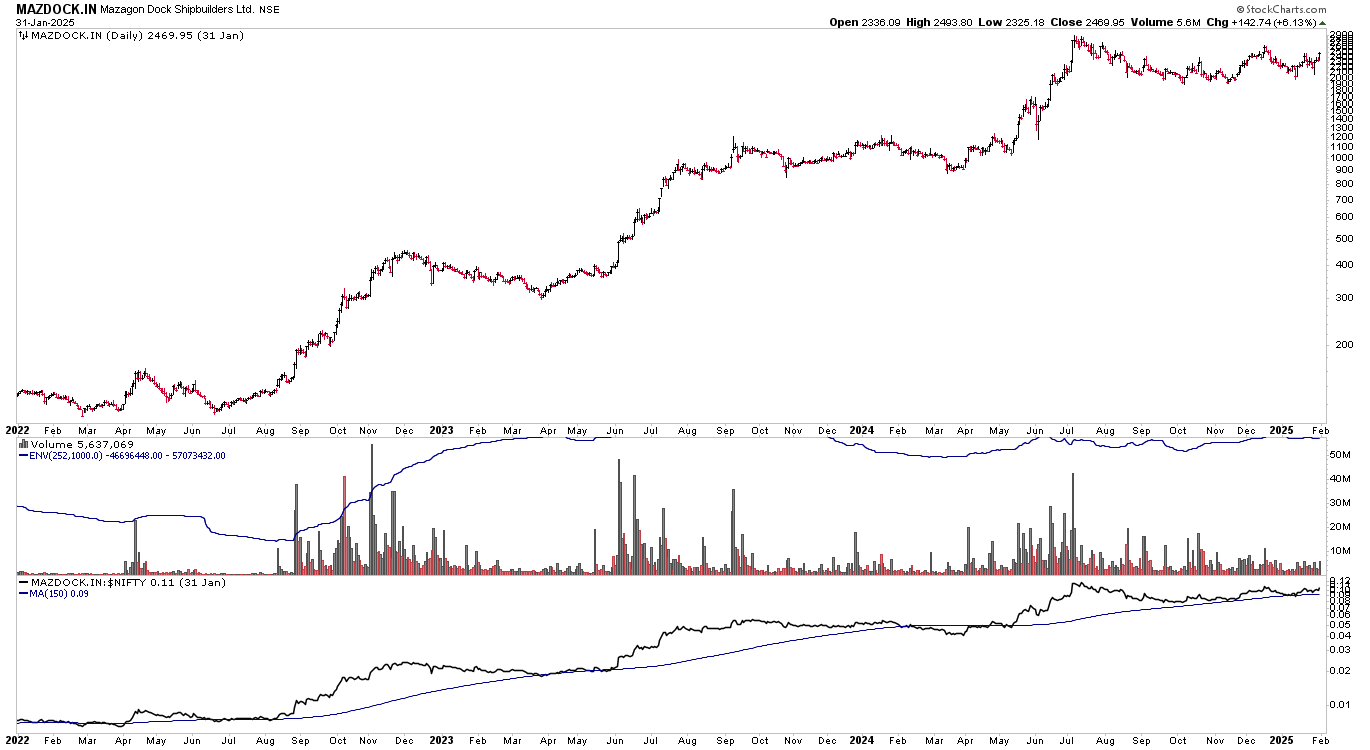
This is a classic example of clustered high volume bars at point of breakout. This along with new highs is a key trait of market leaders. IRFC, E2E, FACT and MAZDOCK are a few more examples of Clustered RVOL action at breakout (charts attached in the Examples section below).
Large Caps and RVOL
This criteria will not apply to mature or large-cap index companies. Or at least, not as frequently as it would to the small and mids. And even if it does, the trend time and move won't be of the same magnitude.
This is logical as a company with a large market doesn't often go up hundreds of percent in the period of 1-2 years. But if and when the RVOL is huge, the same criteria applies. As a matter of fact, the volume can also then act as a point of support or resistance in following corrections.
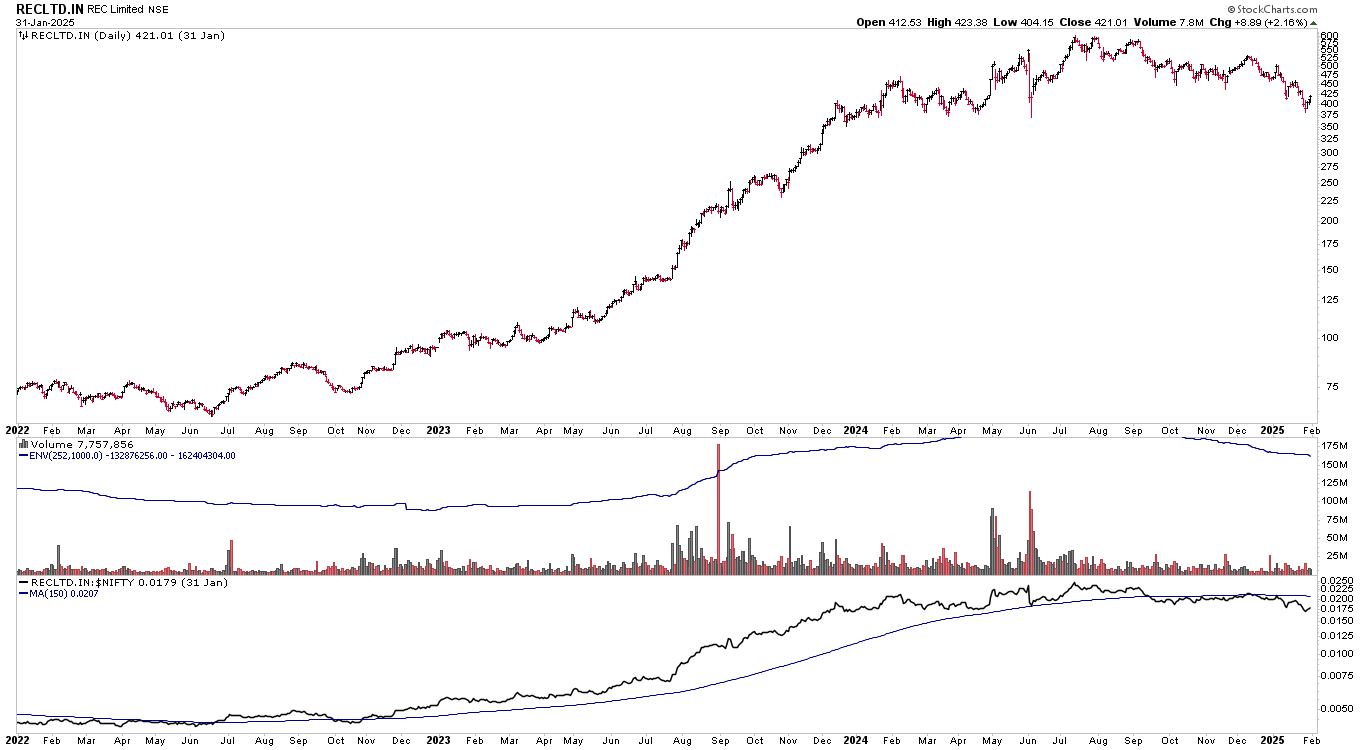
Example: PFC (2023) - Large stock break out without Massive RVOL
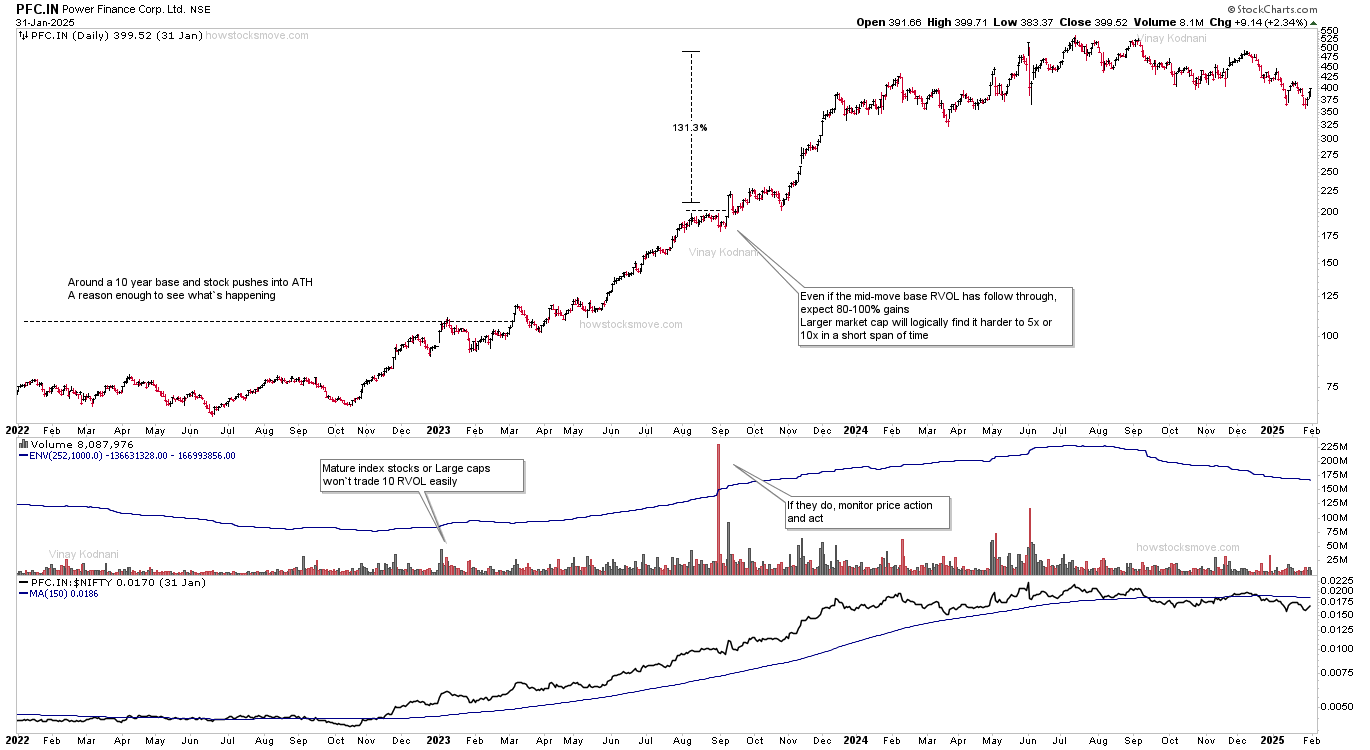
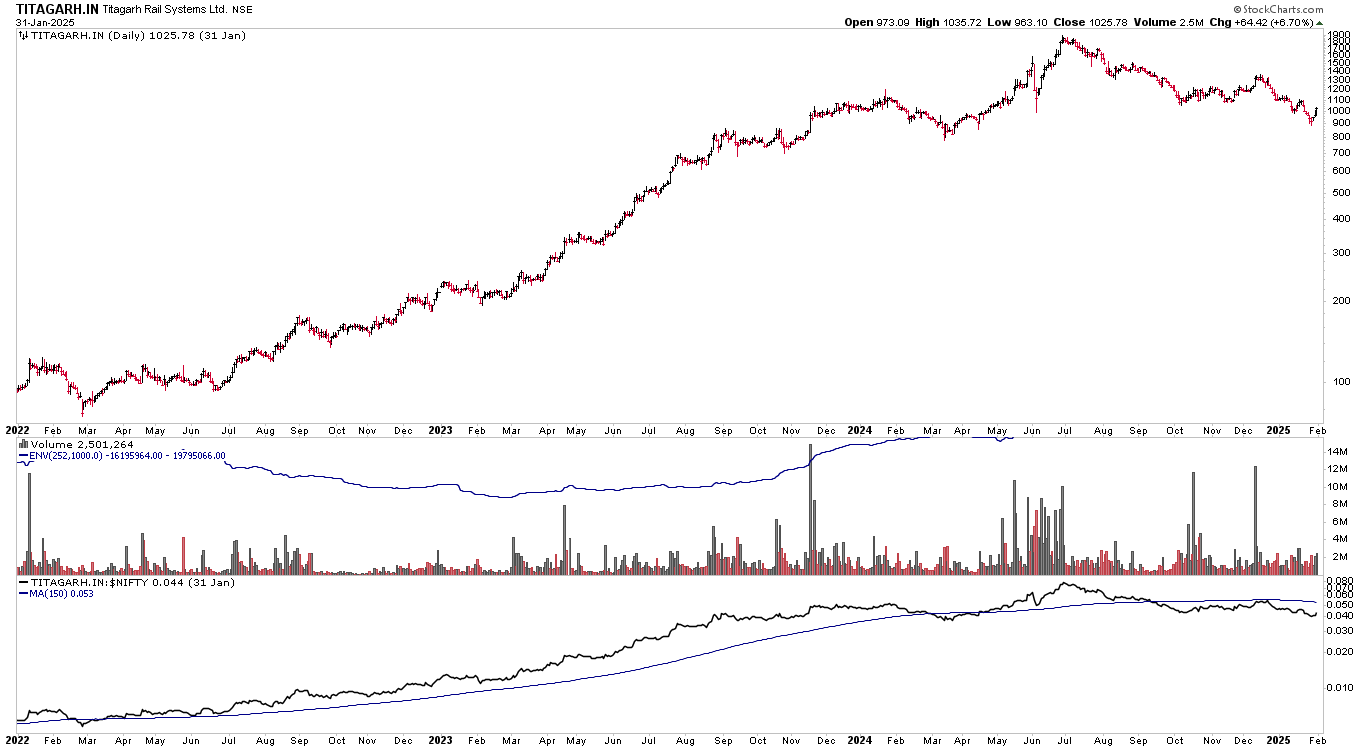
Note how PFC still meets the RVOL threshold at the mid-move base. Similar case can be seen in REC and TITAGARH (charts attached in example section below).
Volume aside, in cases like TITAGARH where the market cap isn't that large, the fact that it came out of almost a +/- 10 year base is reason enough for you to see what's happening (same in the case of PFC and REC).
Catalysts and Earnings as Key Drivers of Price
The reason we use price and volume is that it helps us gauge the position of a stock. Without a catalyst, price has no reason to trend.
The catalyst can be Sales growth, Earnings Growth, a Good Story, a New Product, a Turn-around, or countless other reasons.
Out of these, the one that can create a multi-bagger over multiple years is Sustained Earnings Growth. But, knowing if earnings will sustain is very difficult.
Also, my studies show that the numbers often lag the price and volume action.
- At the bottoms, price often breaks out with volume without the earnings being on the table.
- At the top, price can start tumbling before the numbers have turned negative.
The market always prices the future, and there are countless smart institutions and speculators buying and unwinding positions in anticipation of the future.
Managing positions and selling is the hardest part, but I hope my study can help you aim to hold for AT LEAST 4-6 quarters. From there, I suggest tracking quarterly and annual sales and profit figures along with price and volume action to gauge how the stock is performing.
A few negative quarters or a sharp correction after a big move up in a market correction are normal in most multi-year mega trends so it then becomes a discretionary game of never-ending learning form thereon. Again, in general, sustained ROE and EPS growth are your best bet from there.
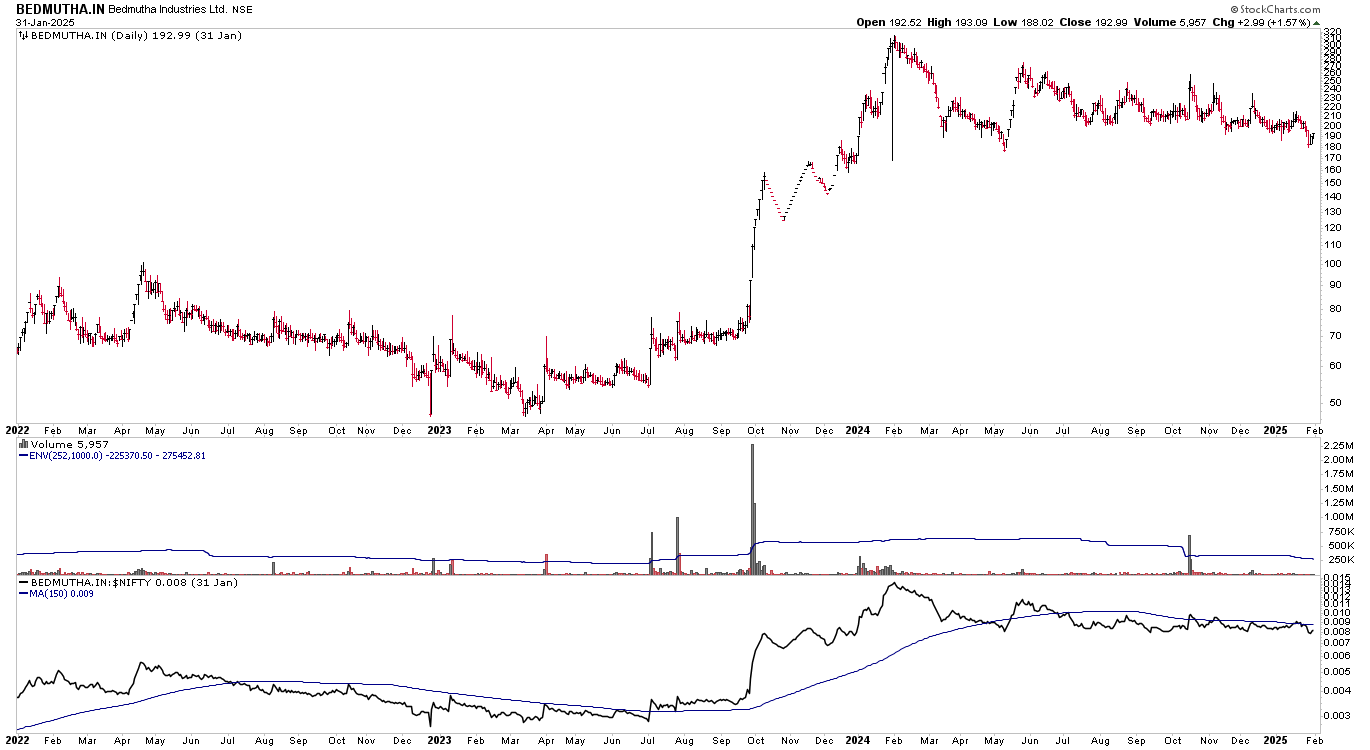
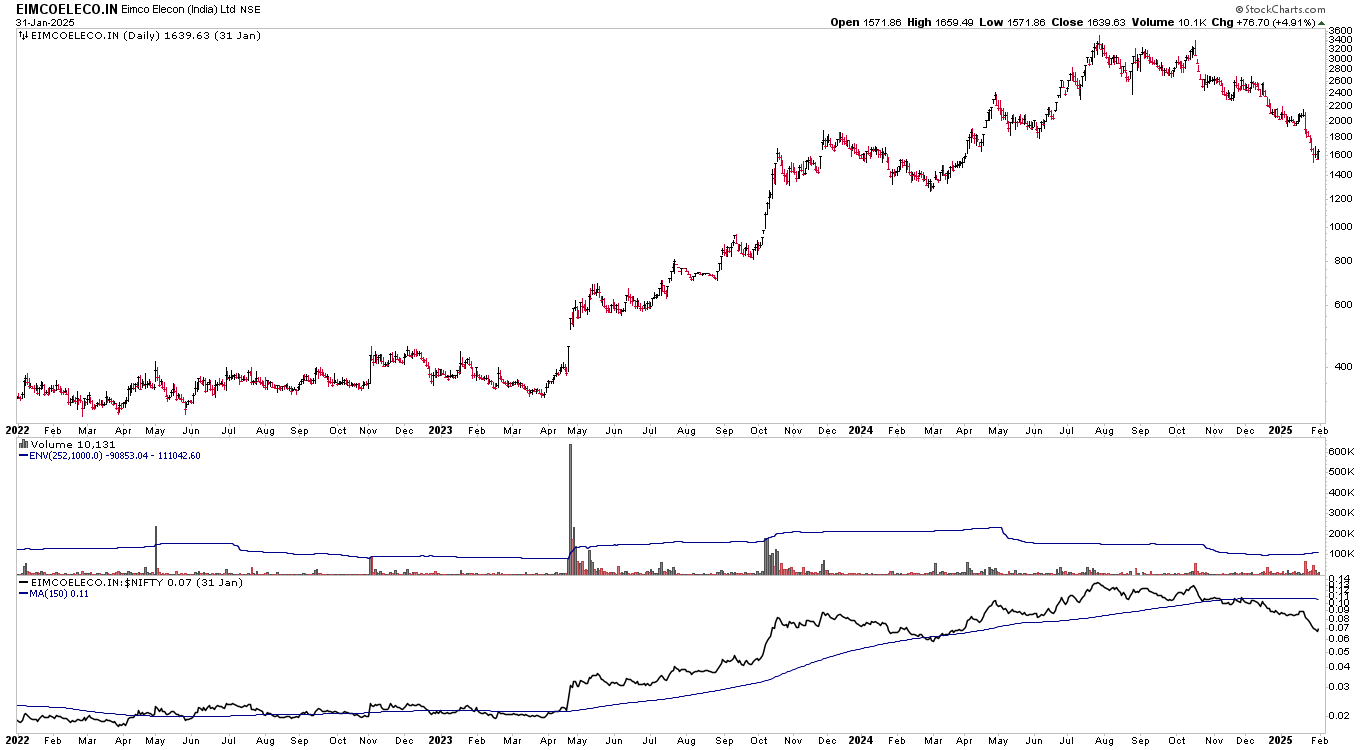
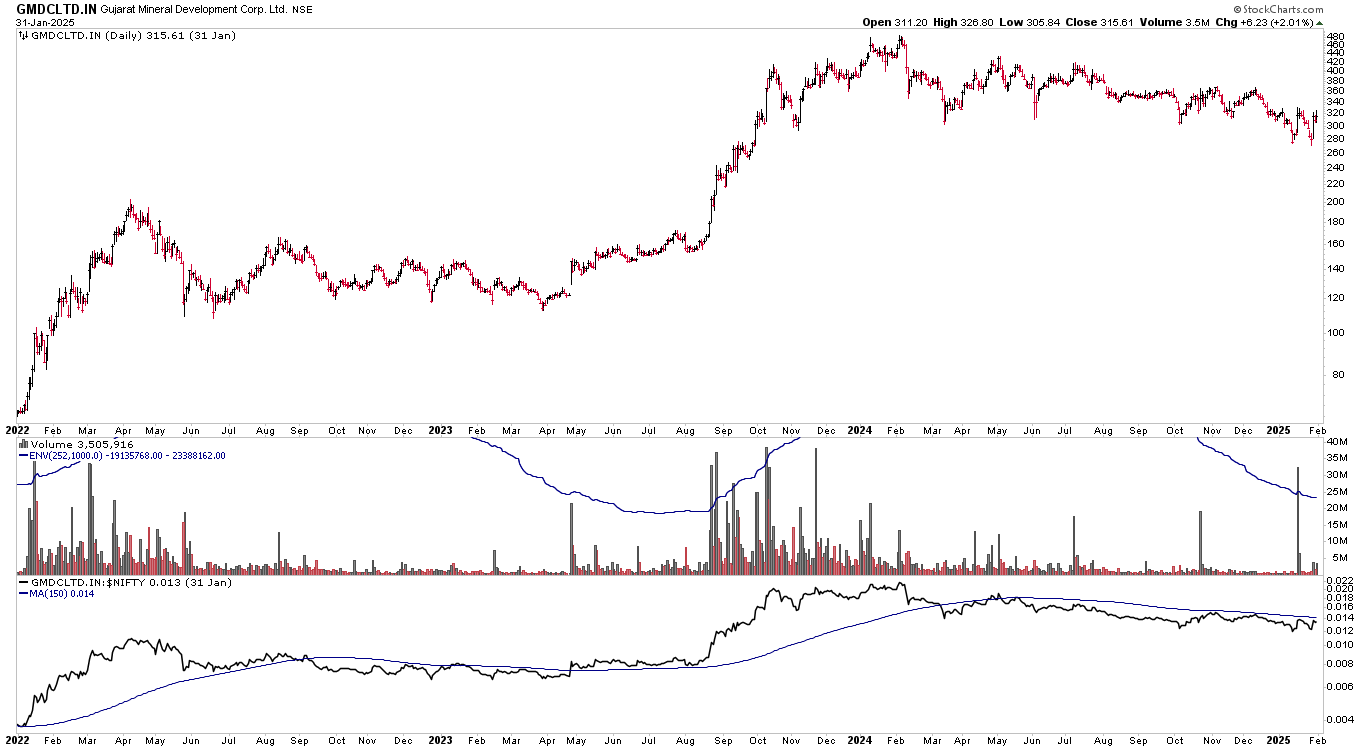
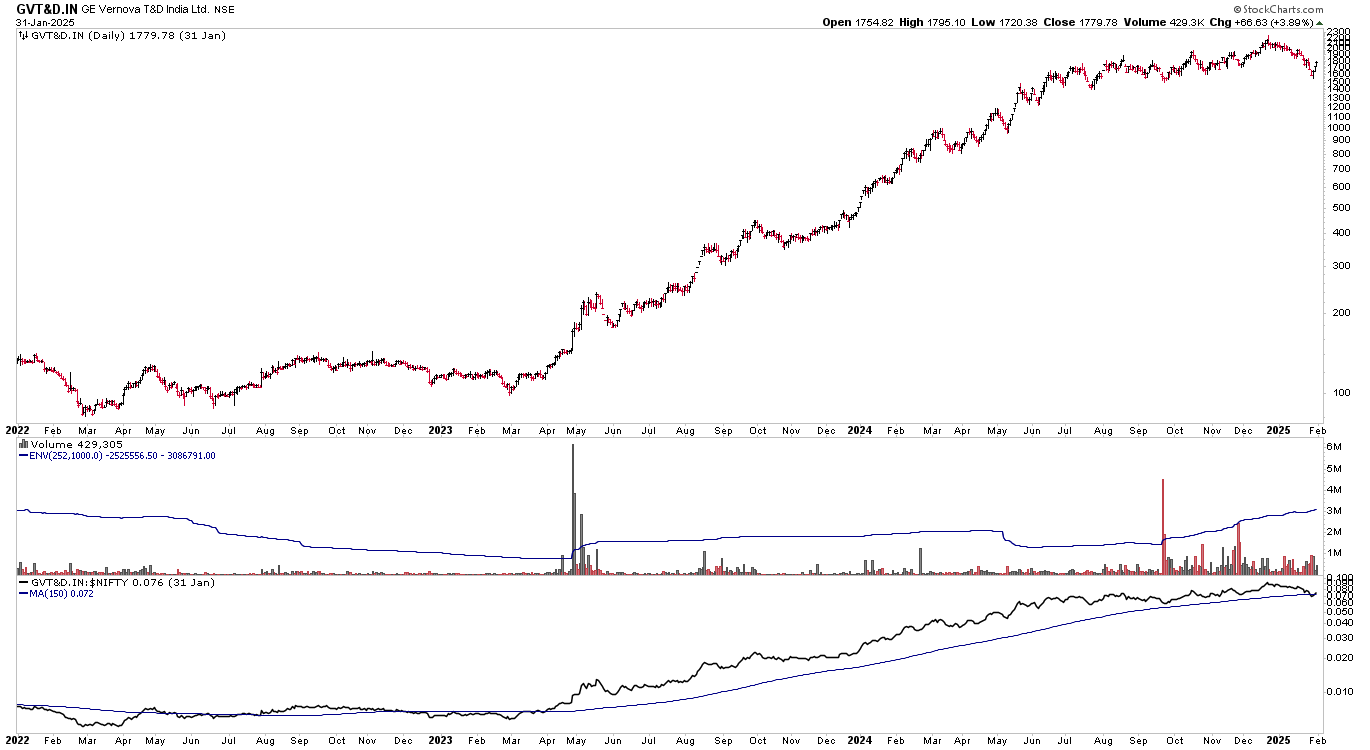
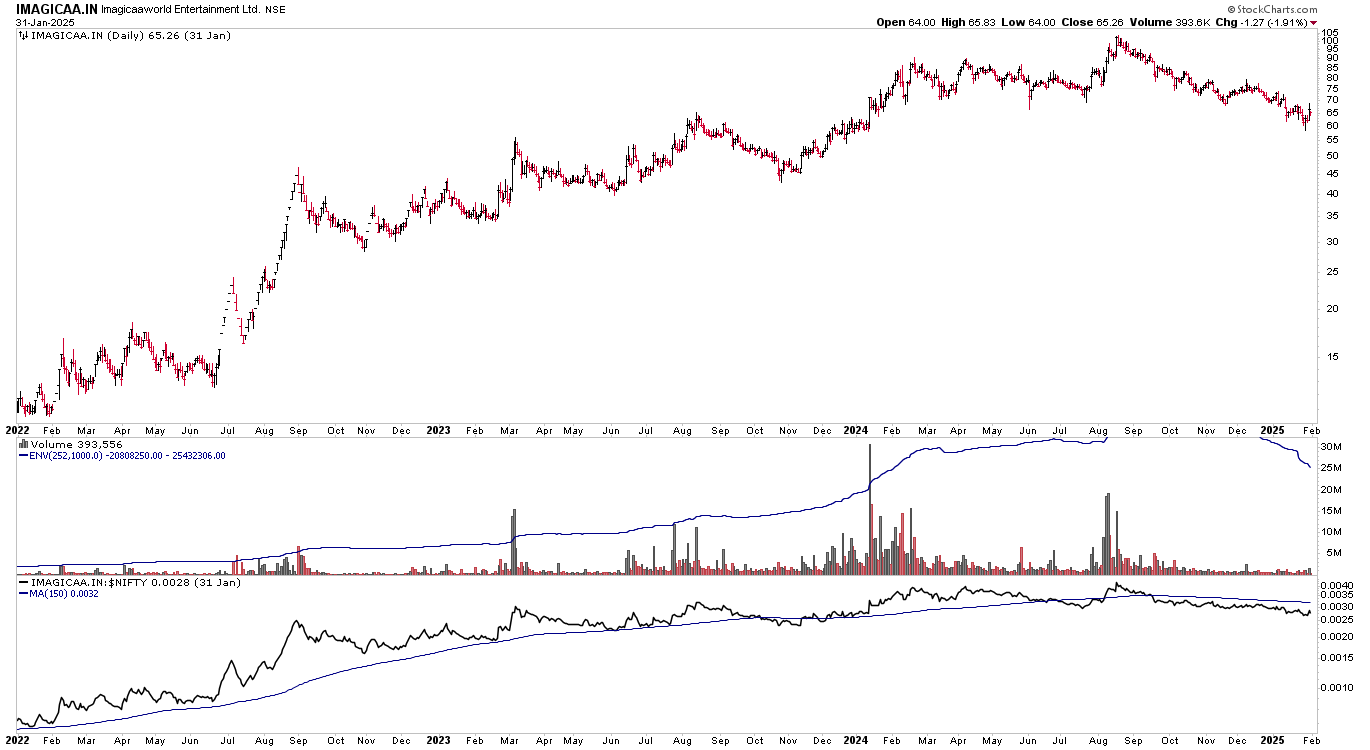
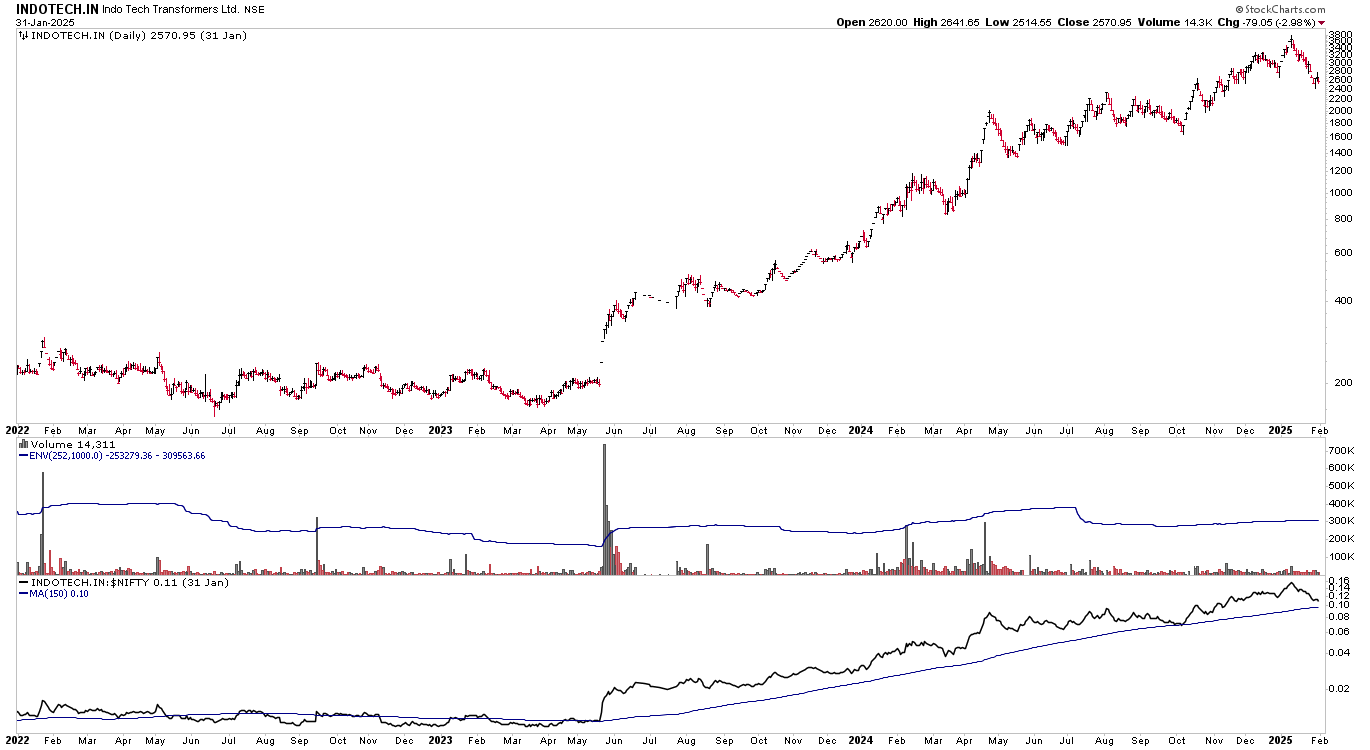
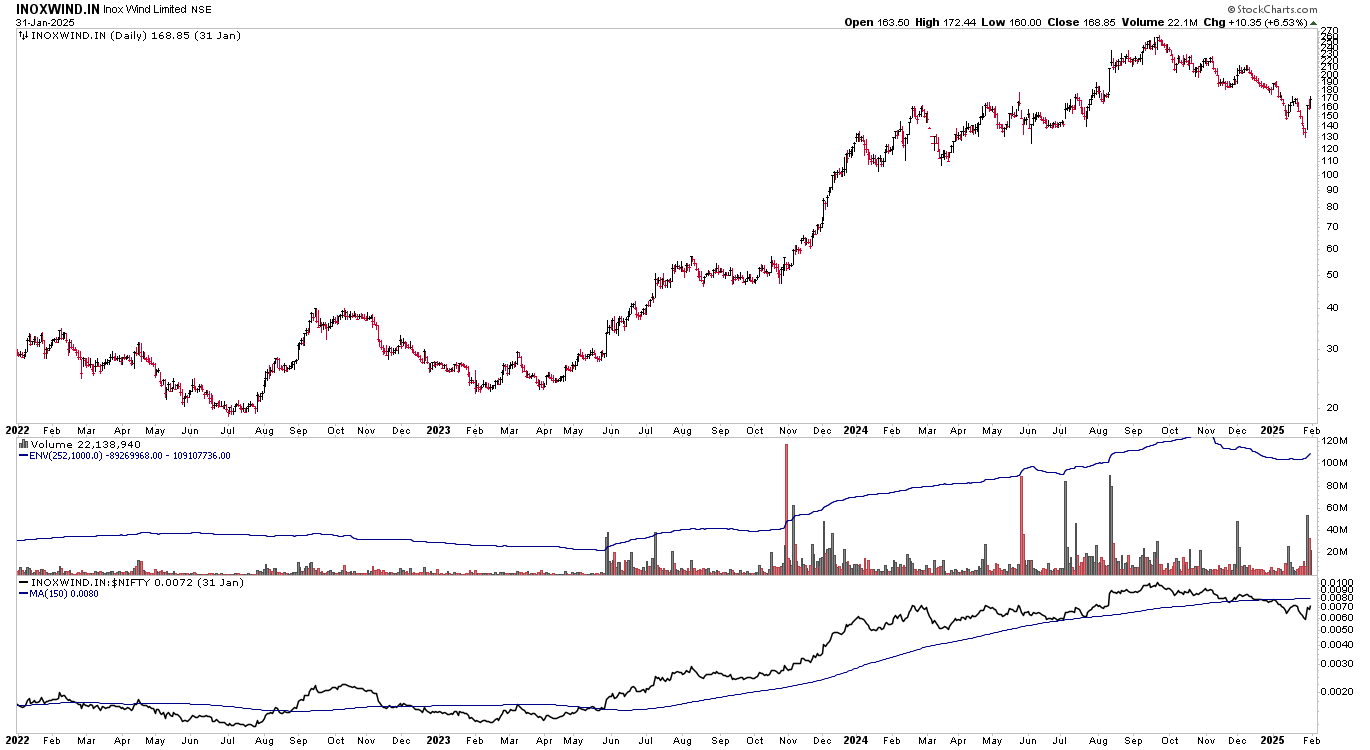
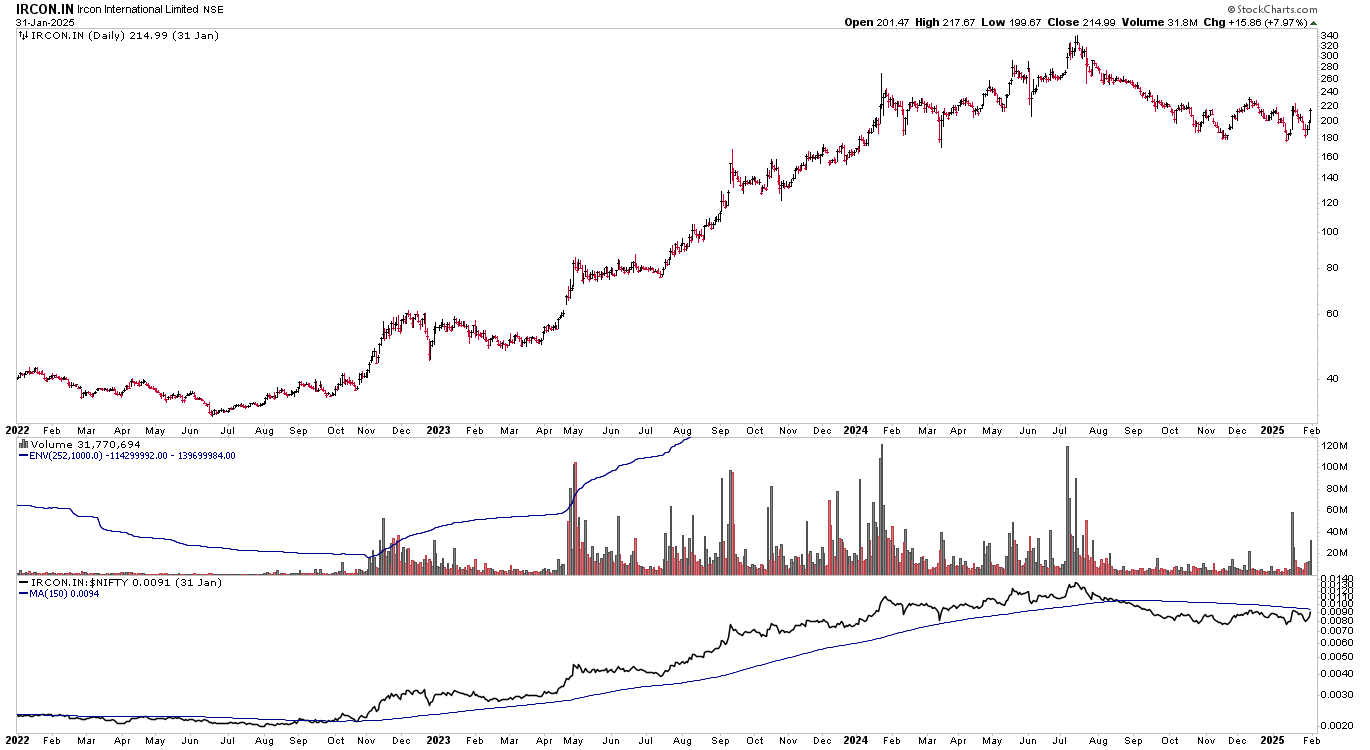
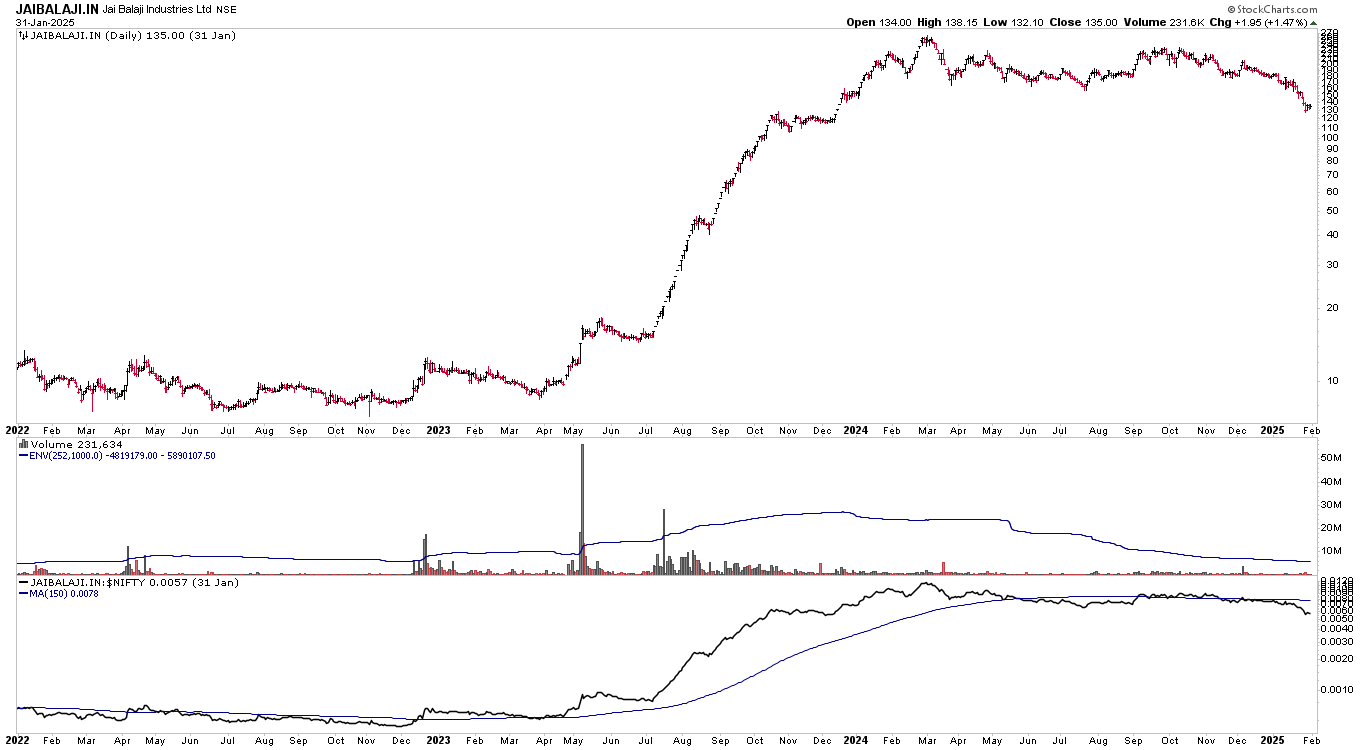
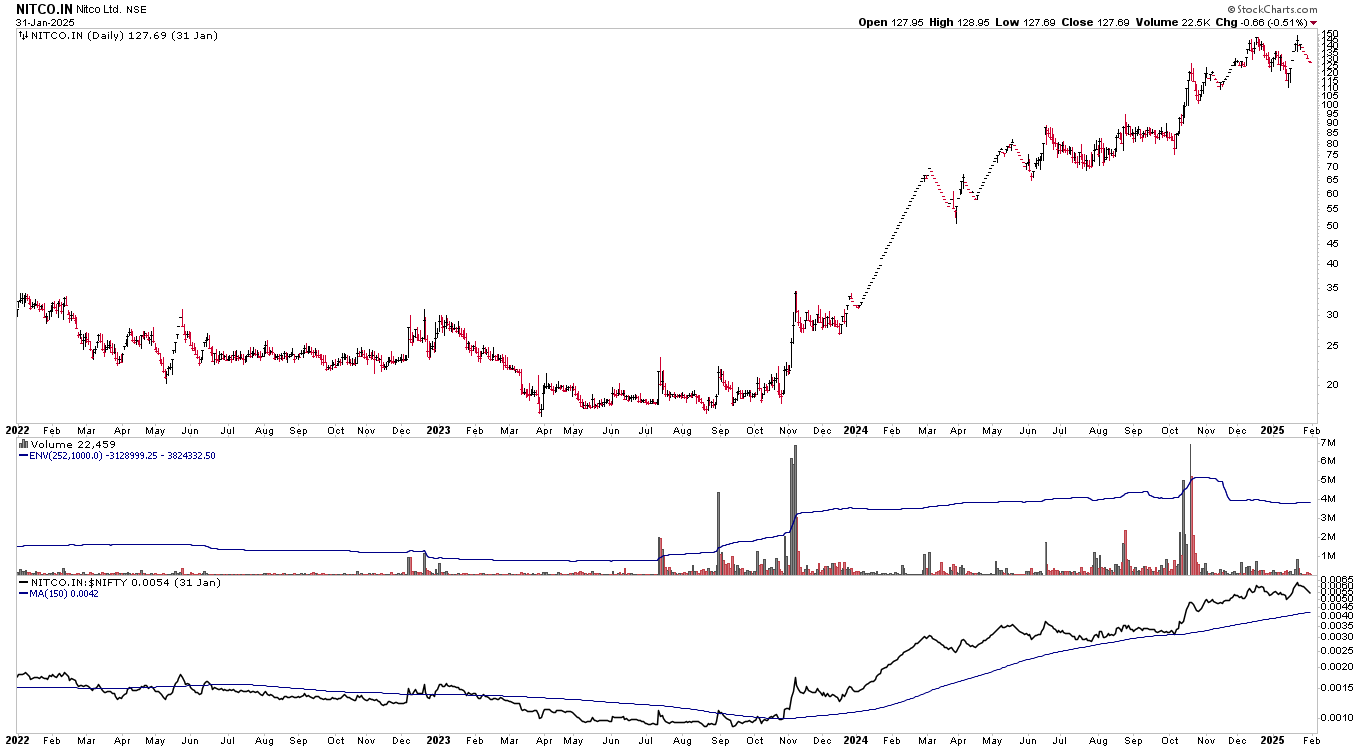
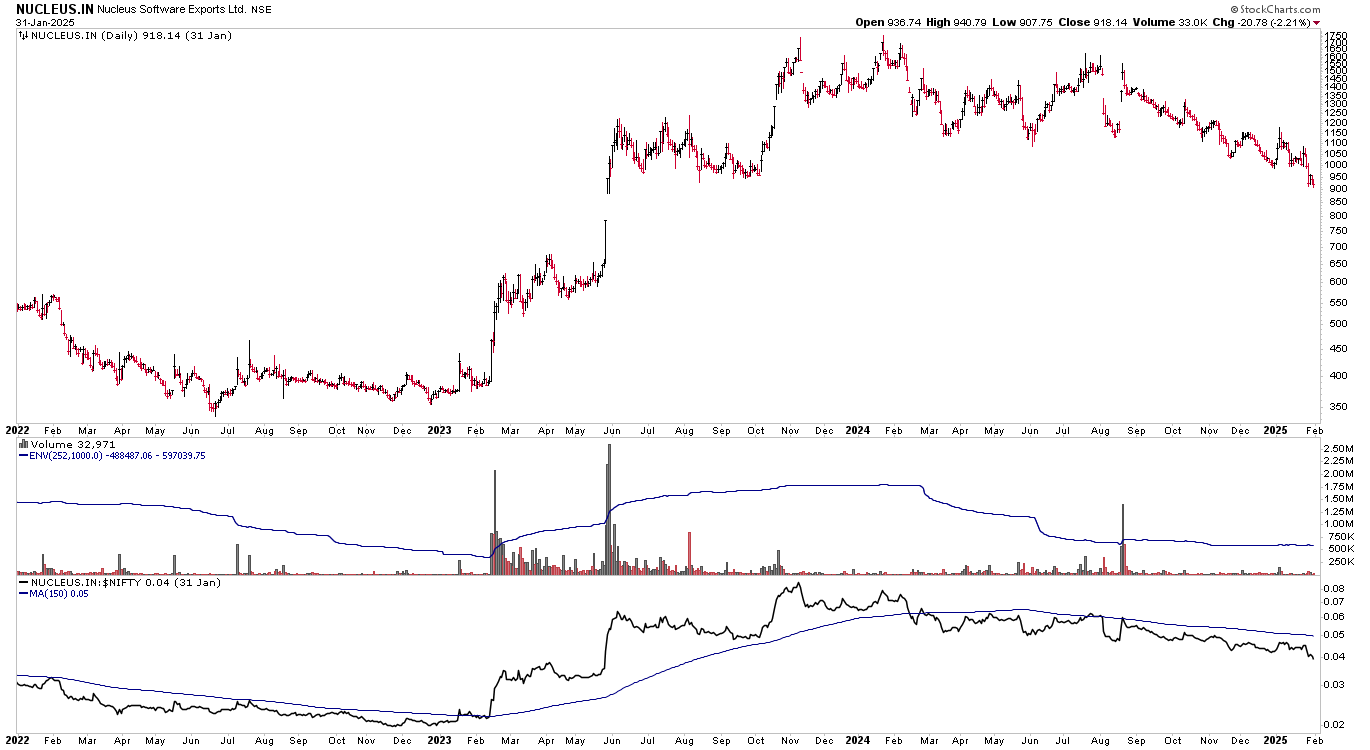
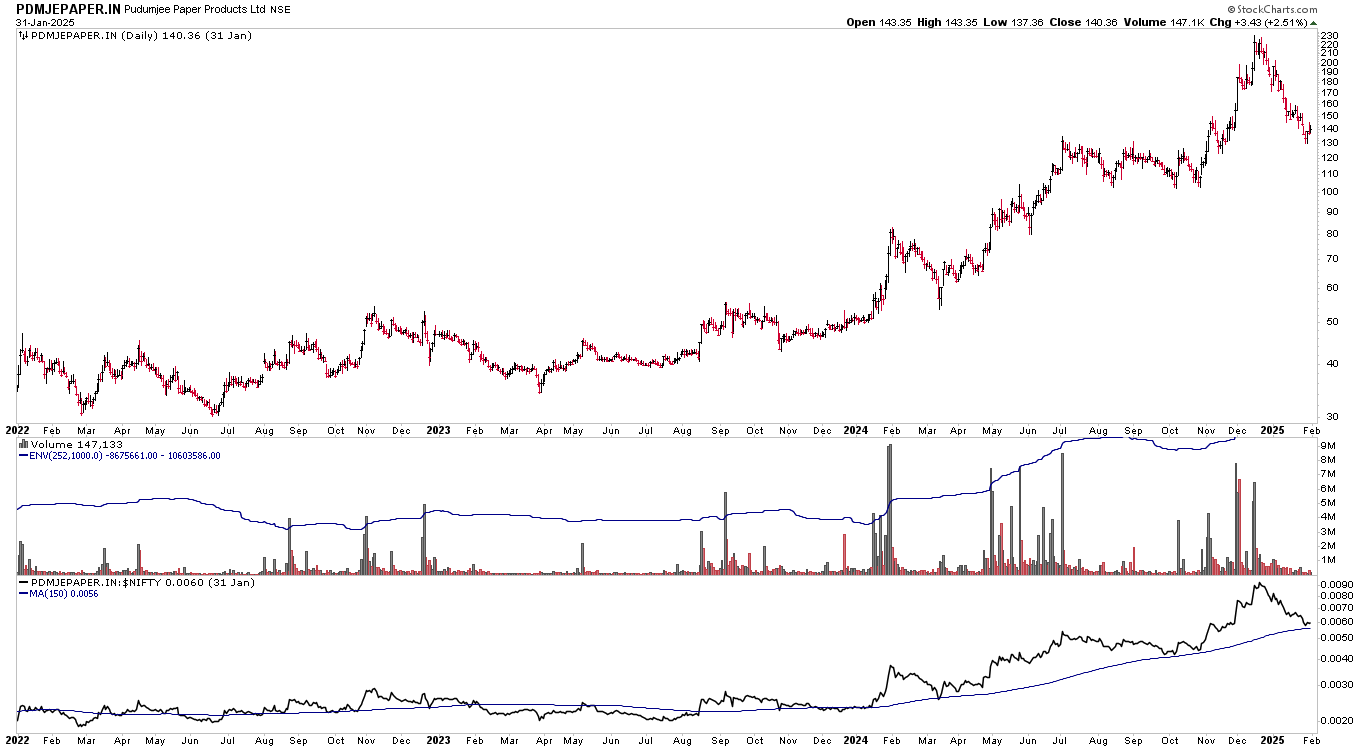
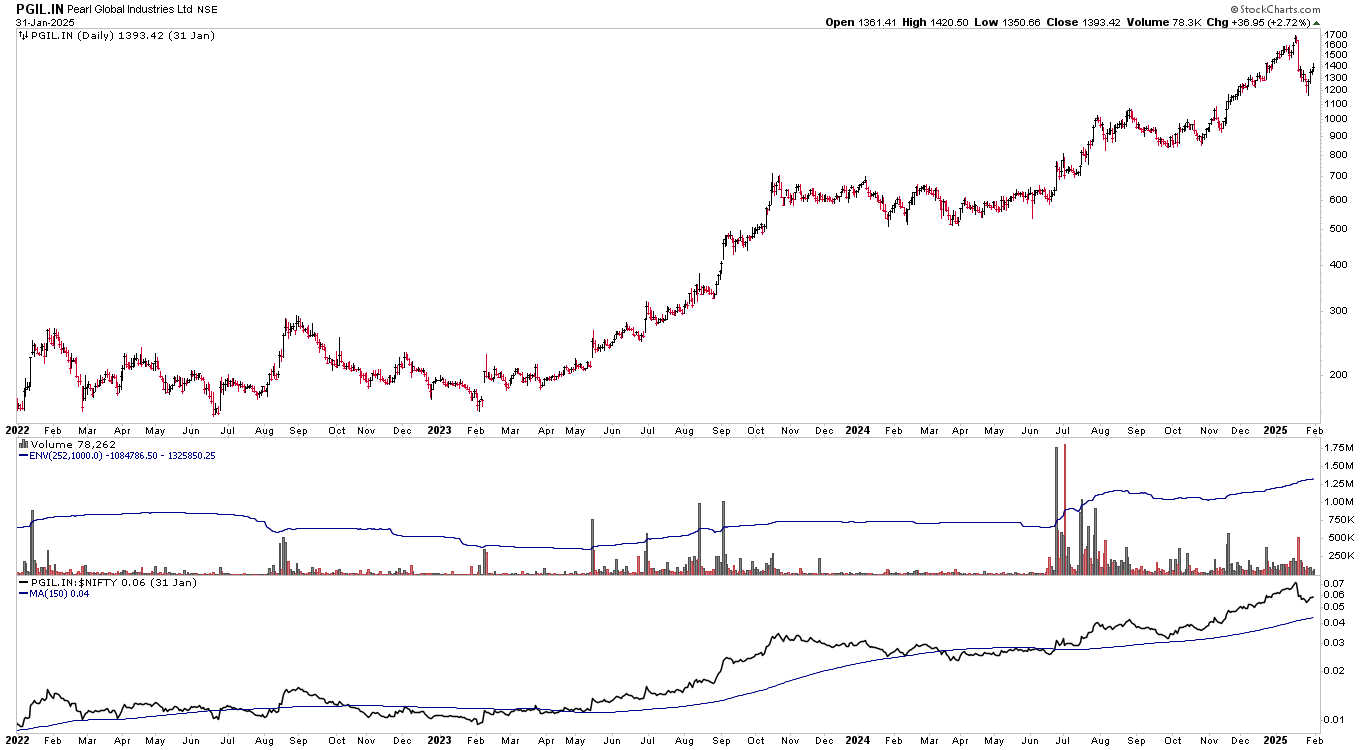
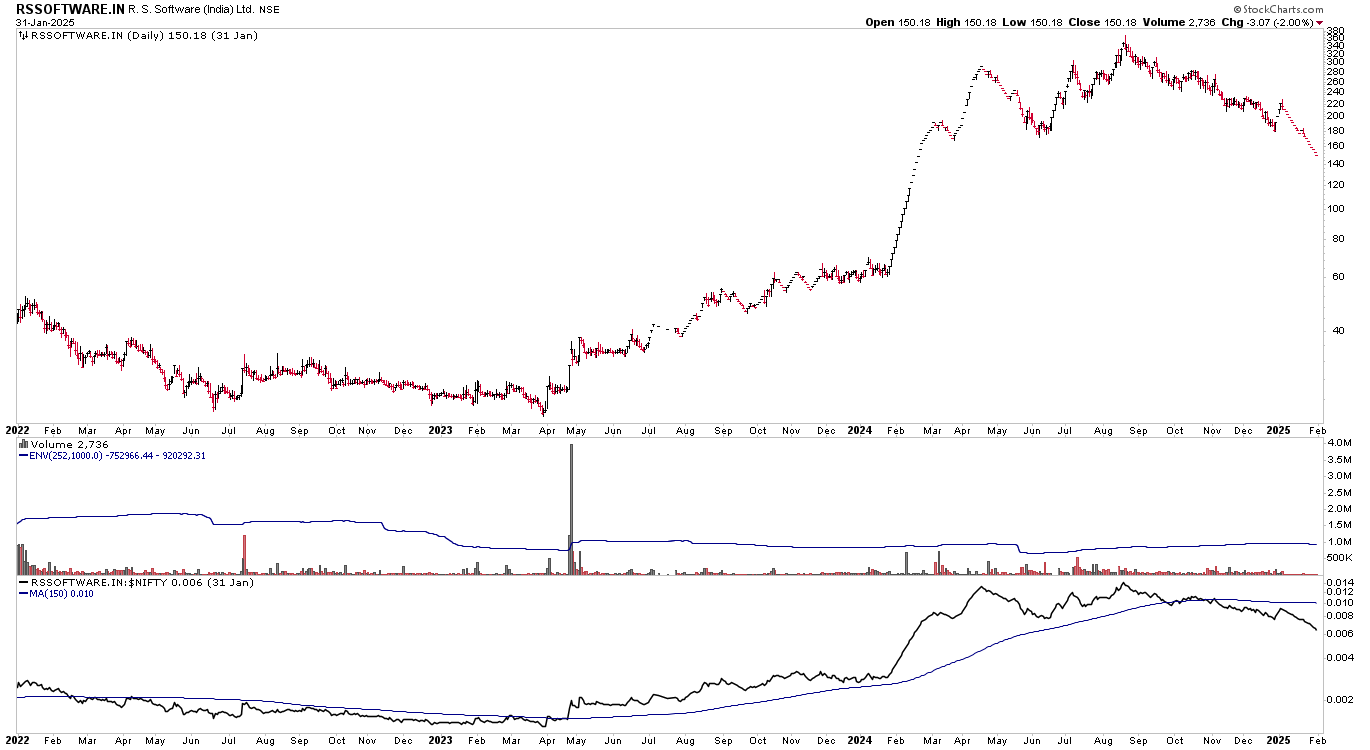
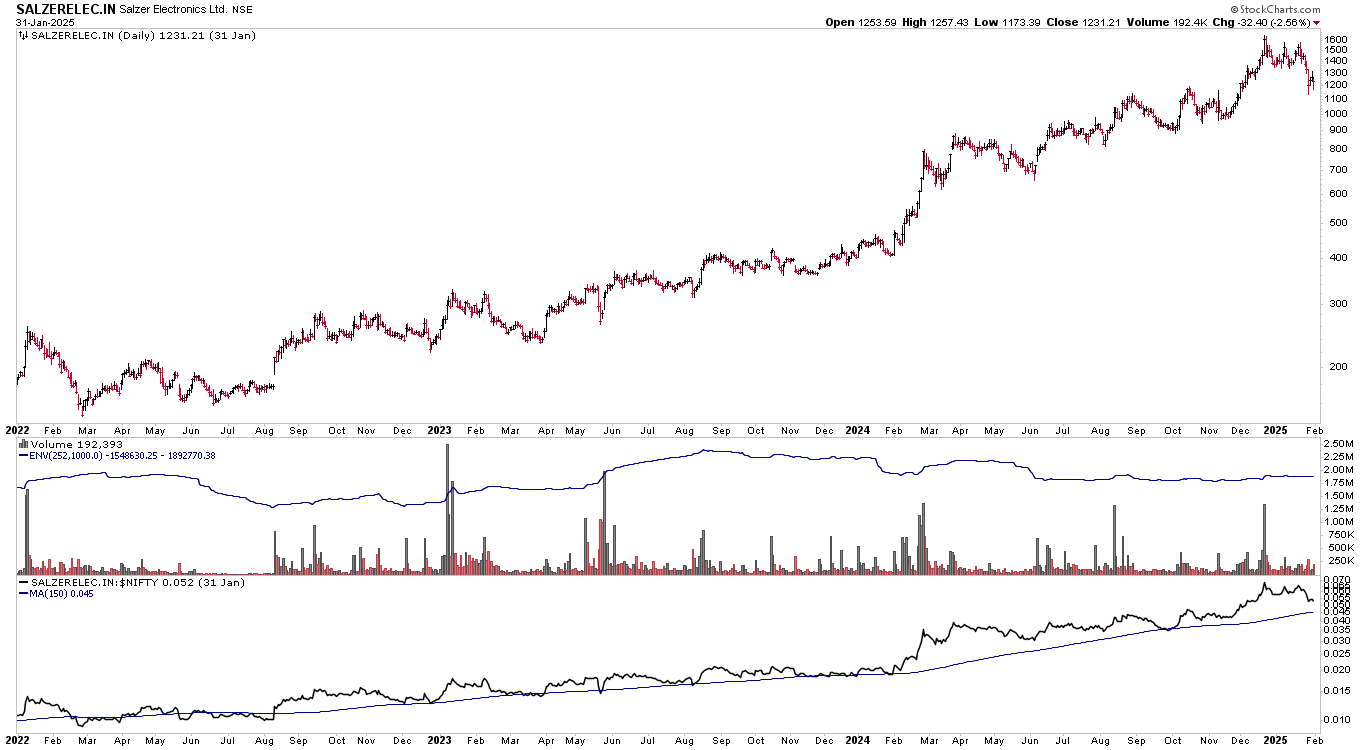
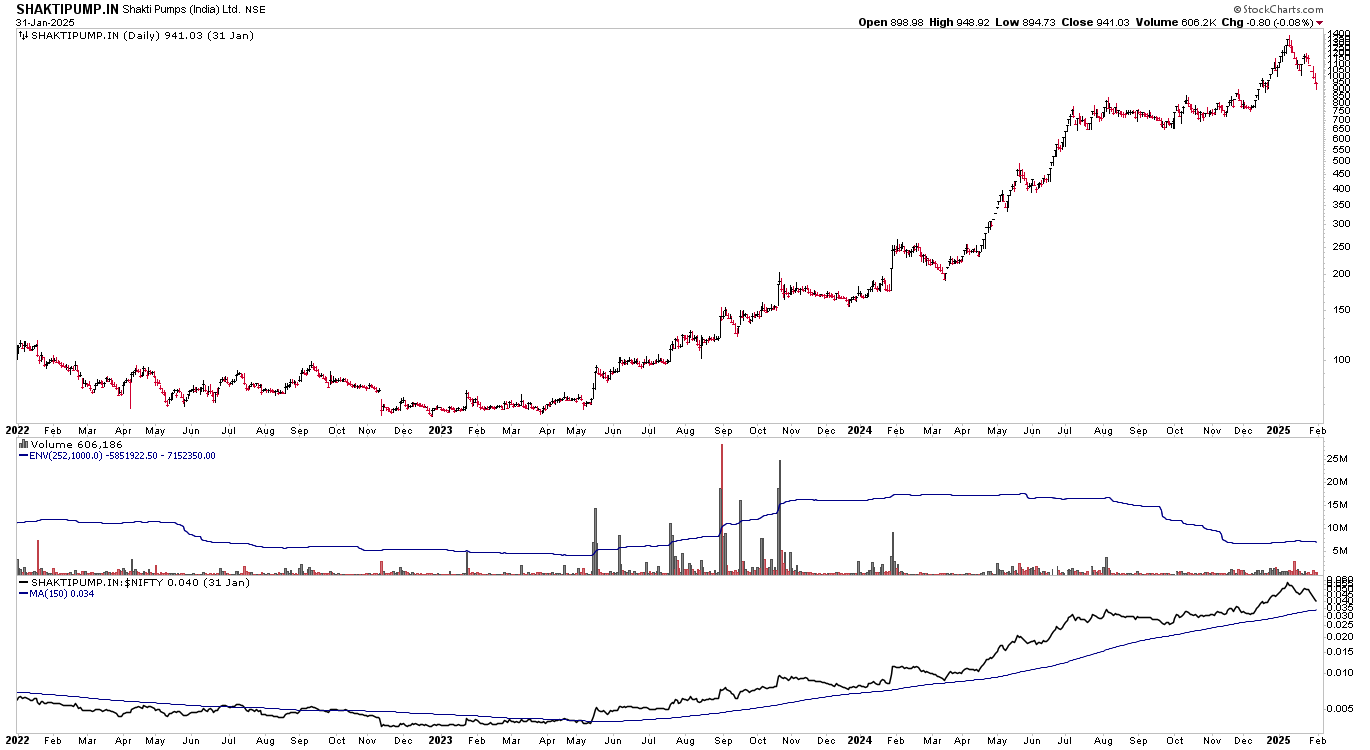
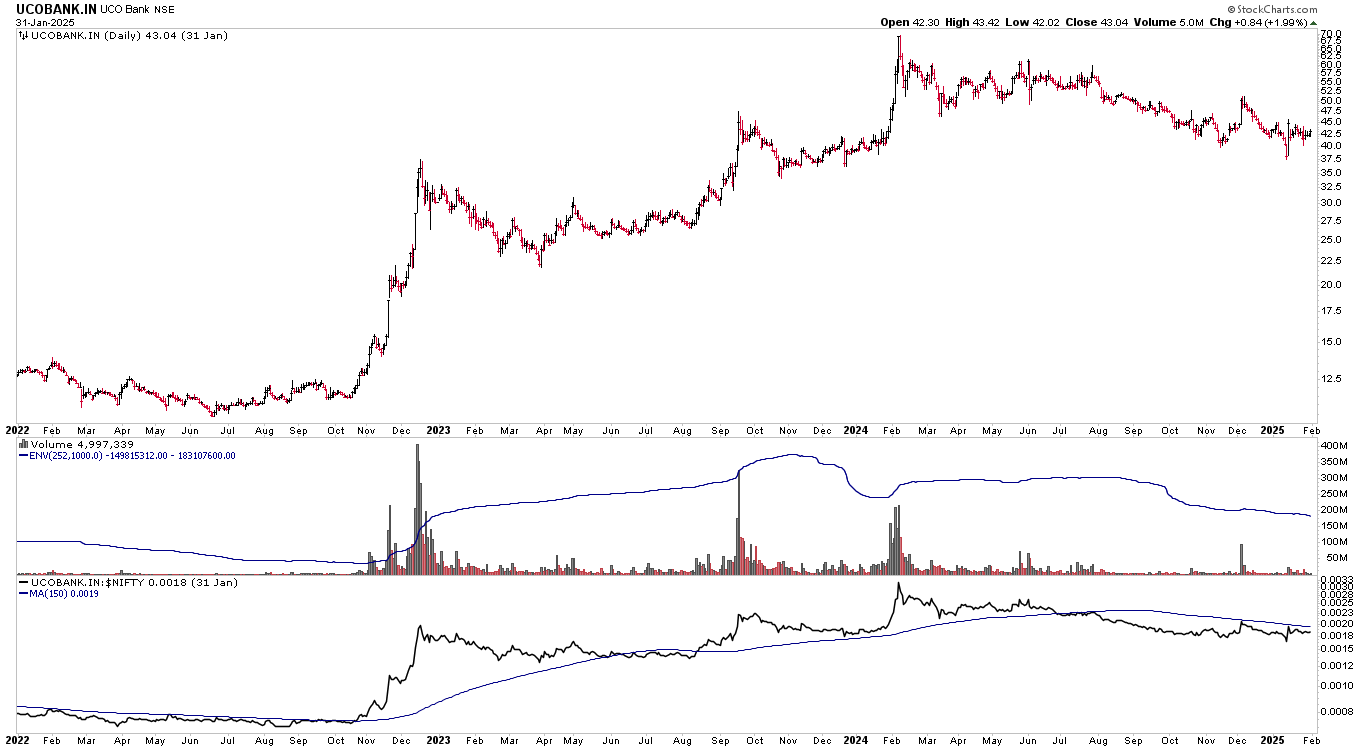
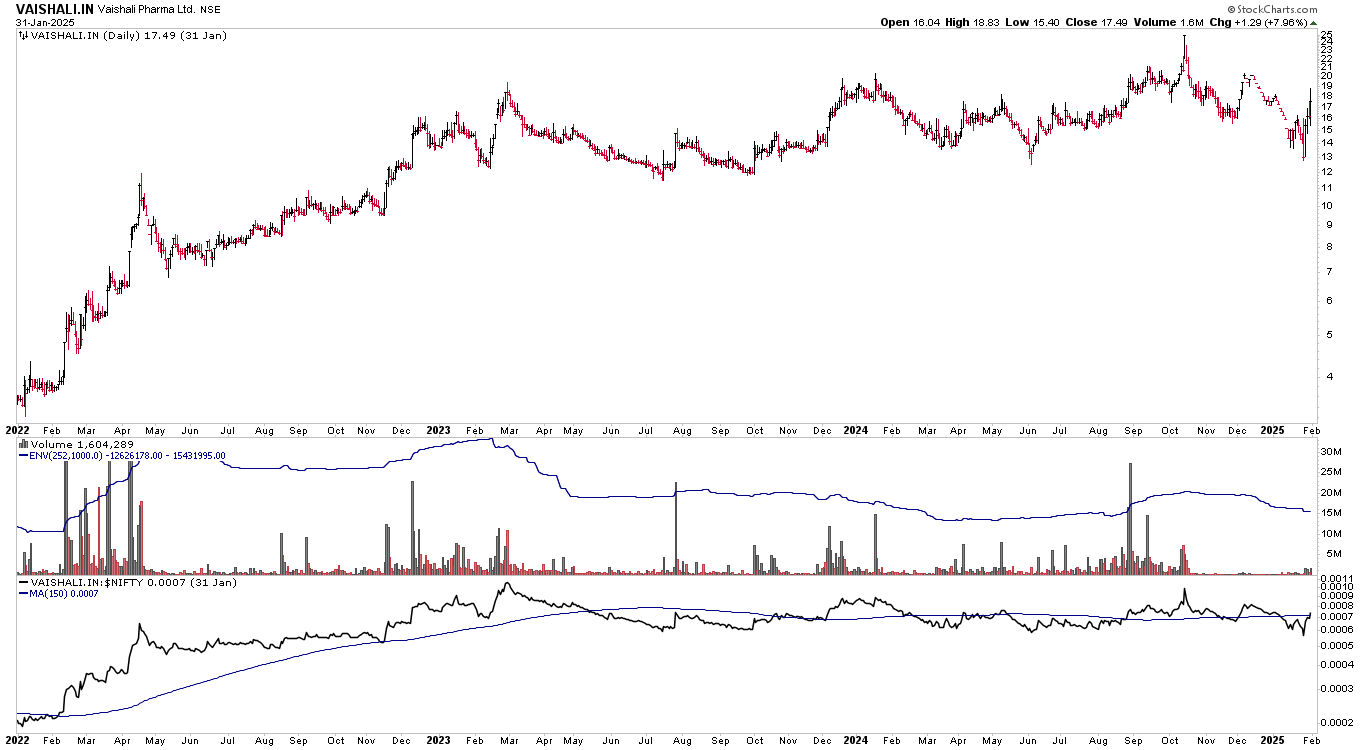
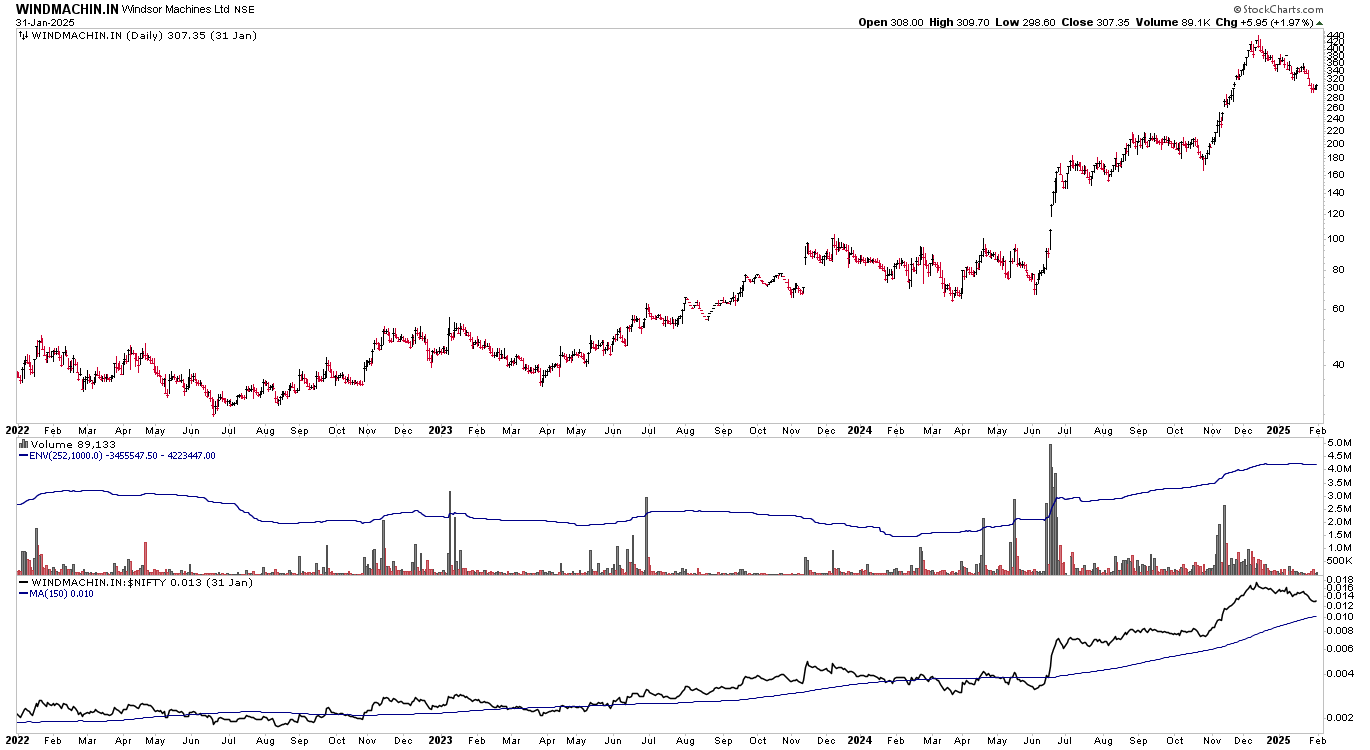
Examples: Relative Volume and Market Leaders
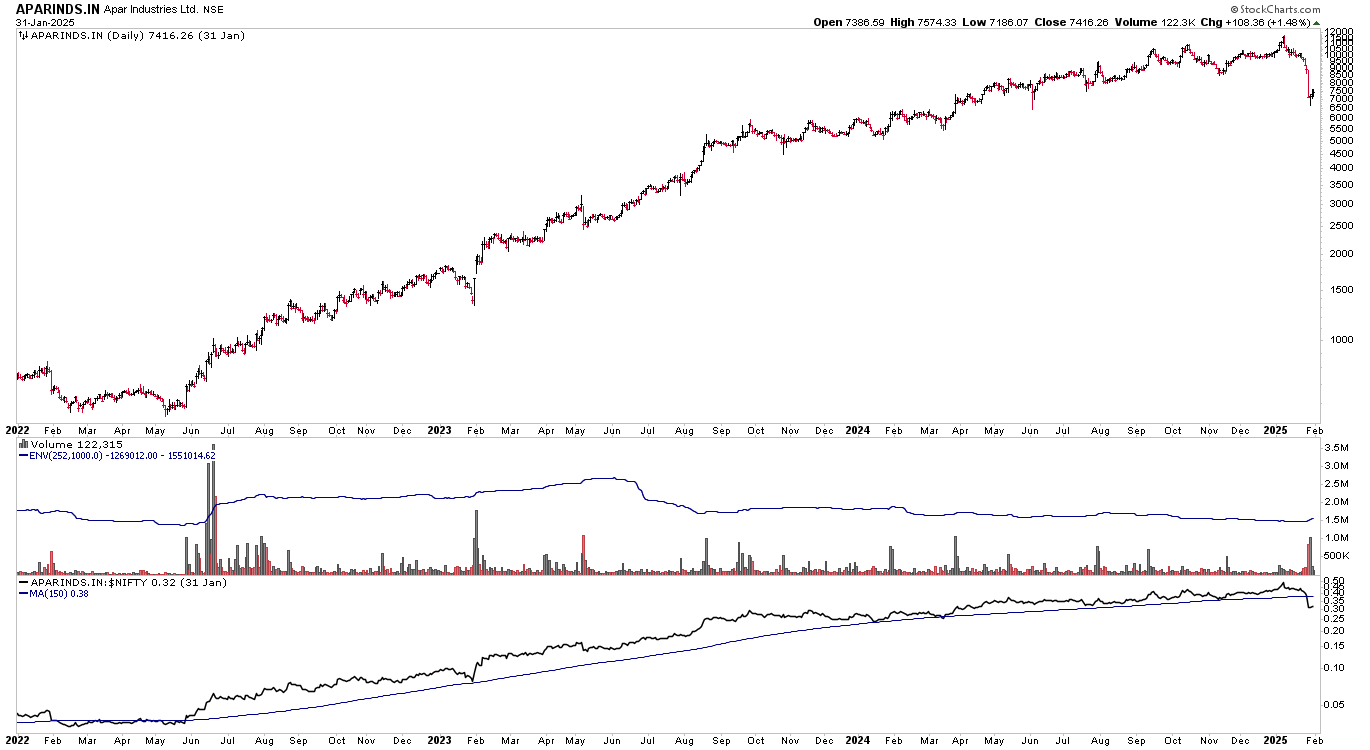
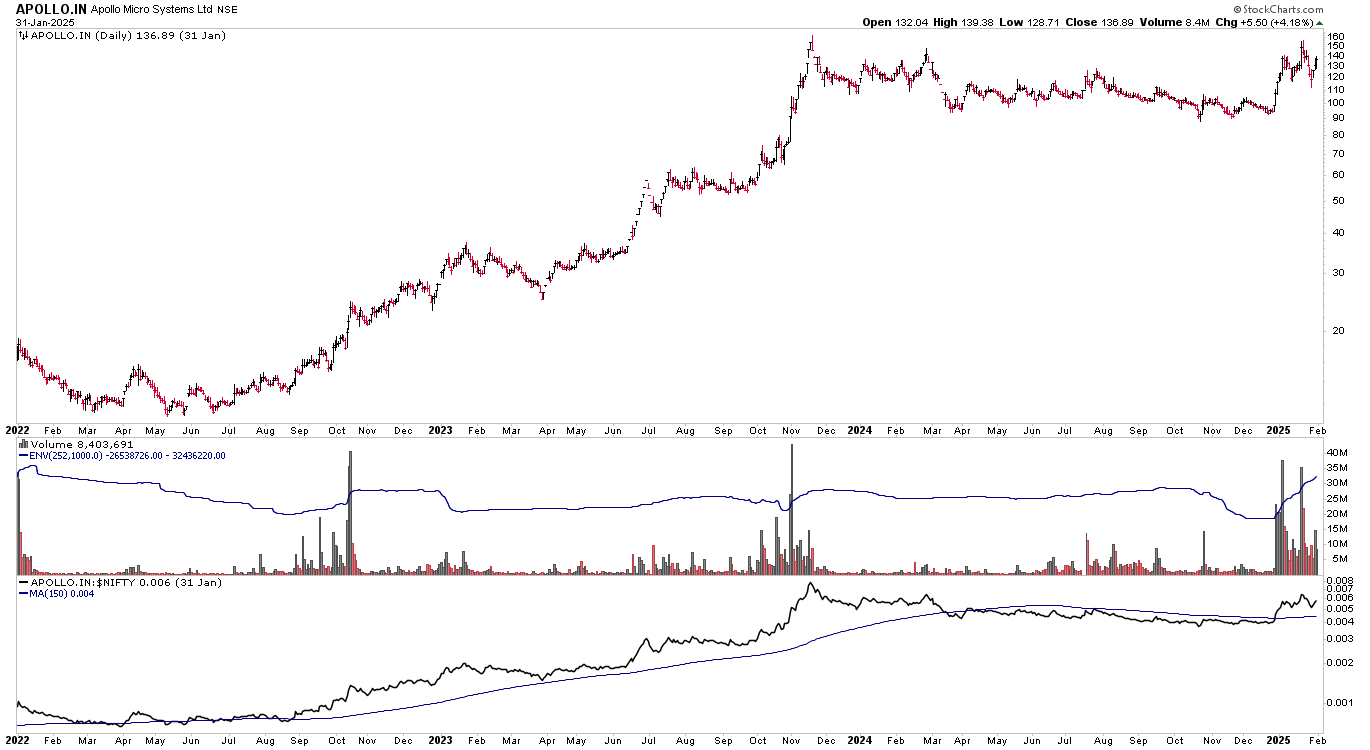
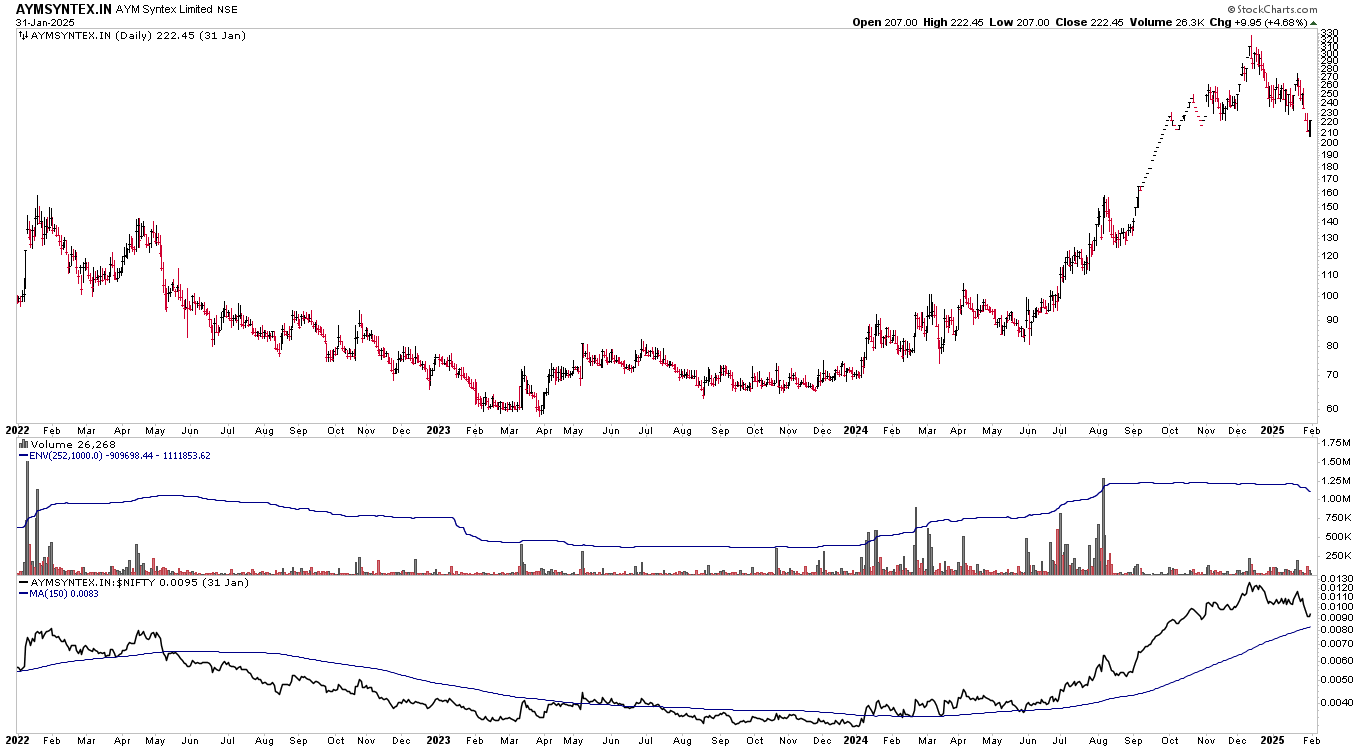
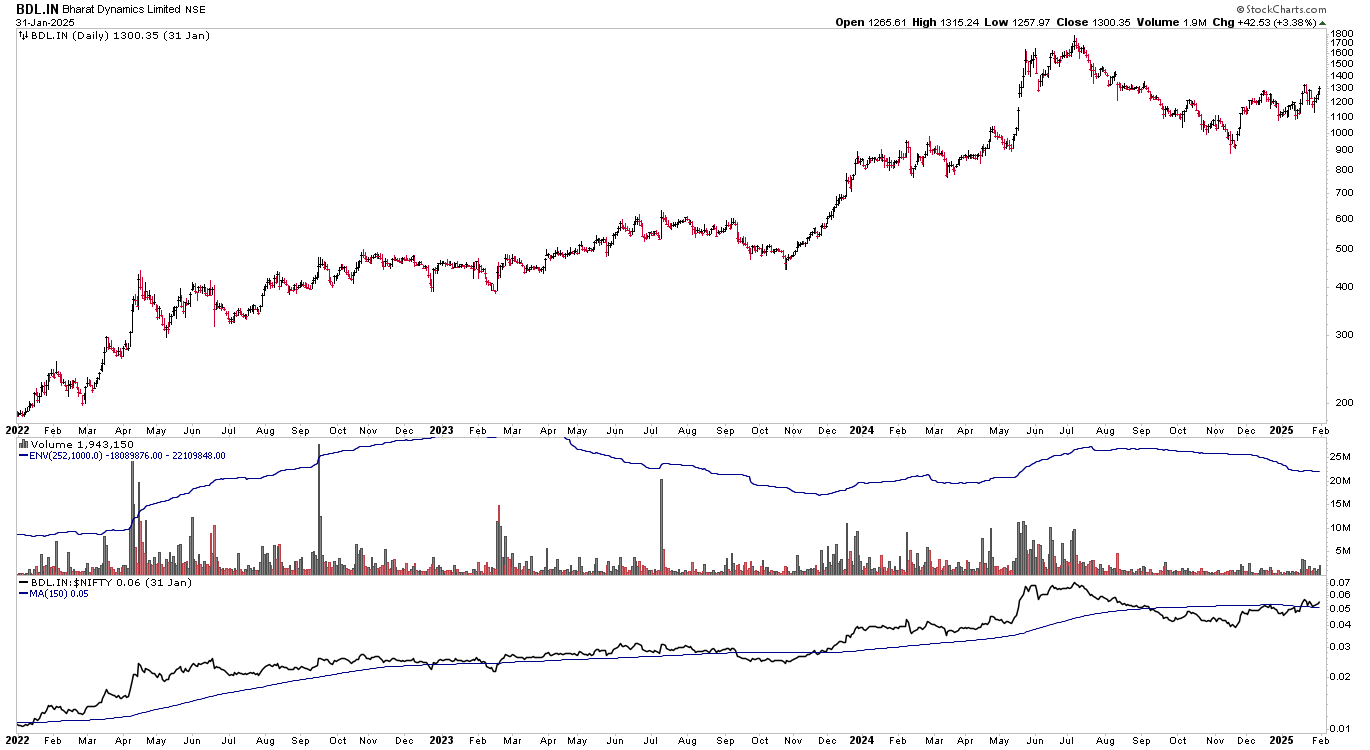
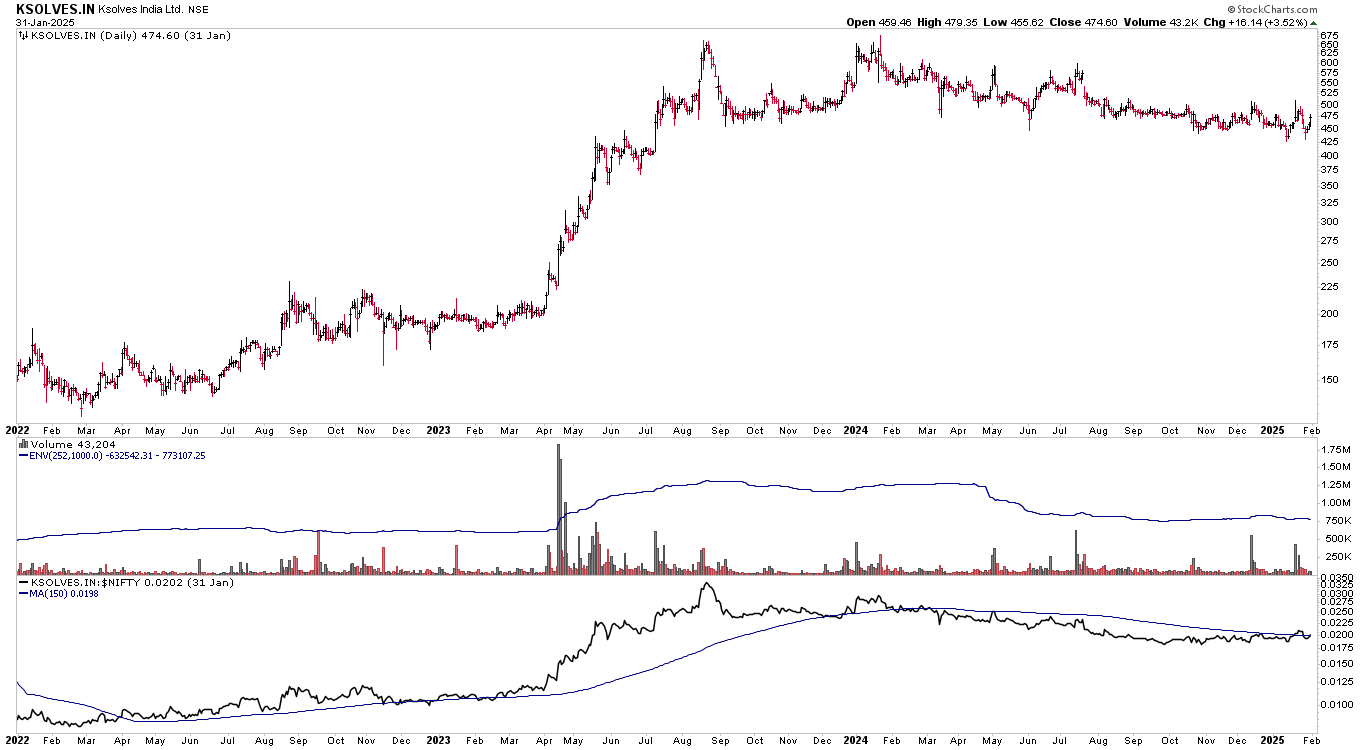
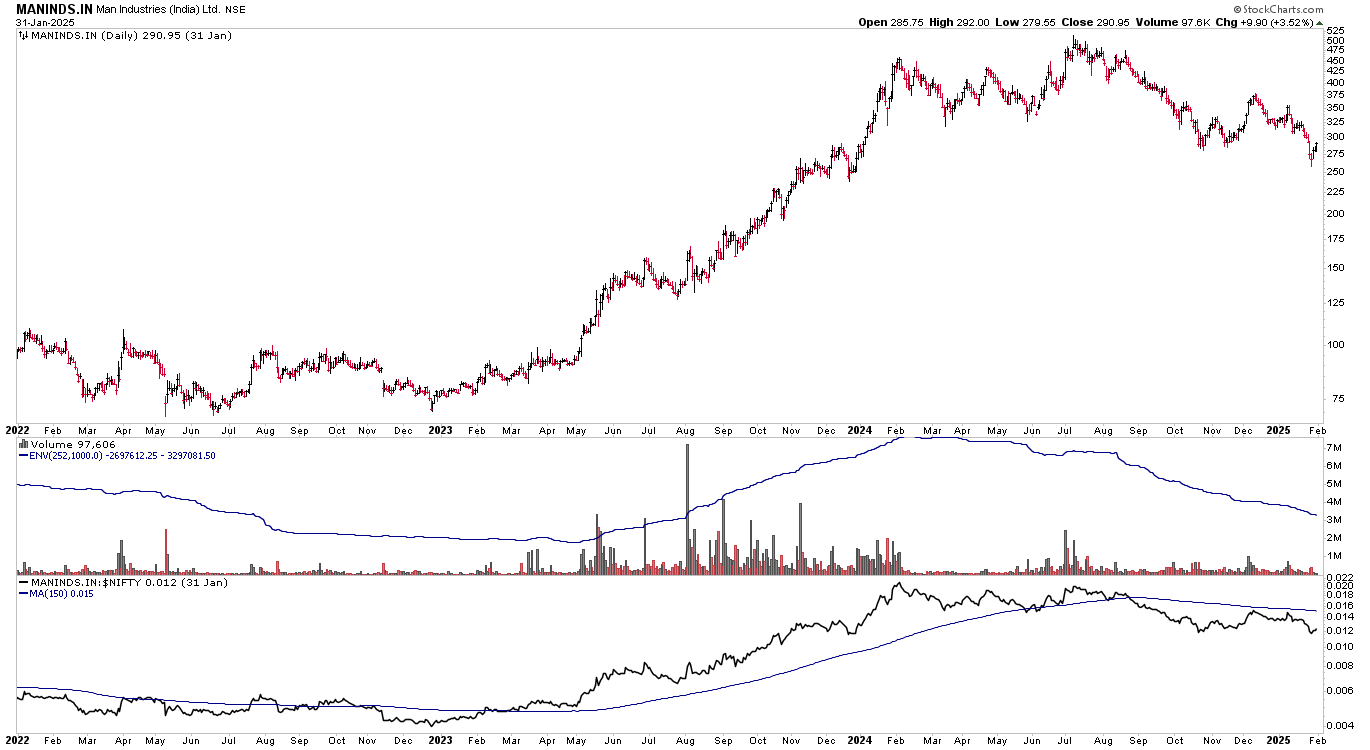
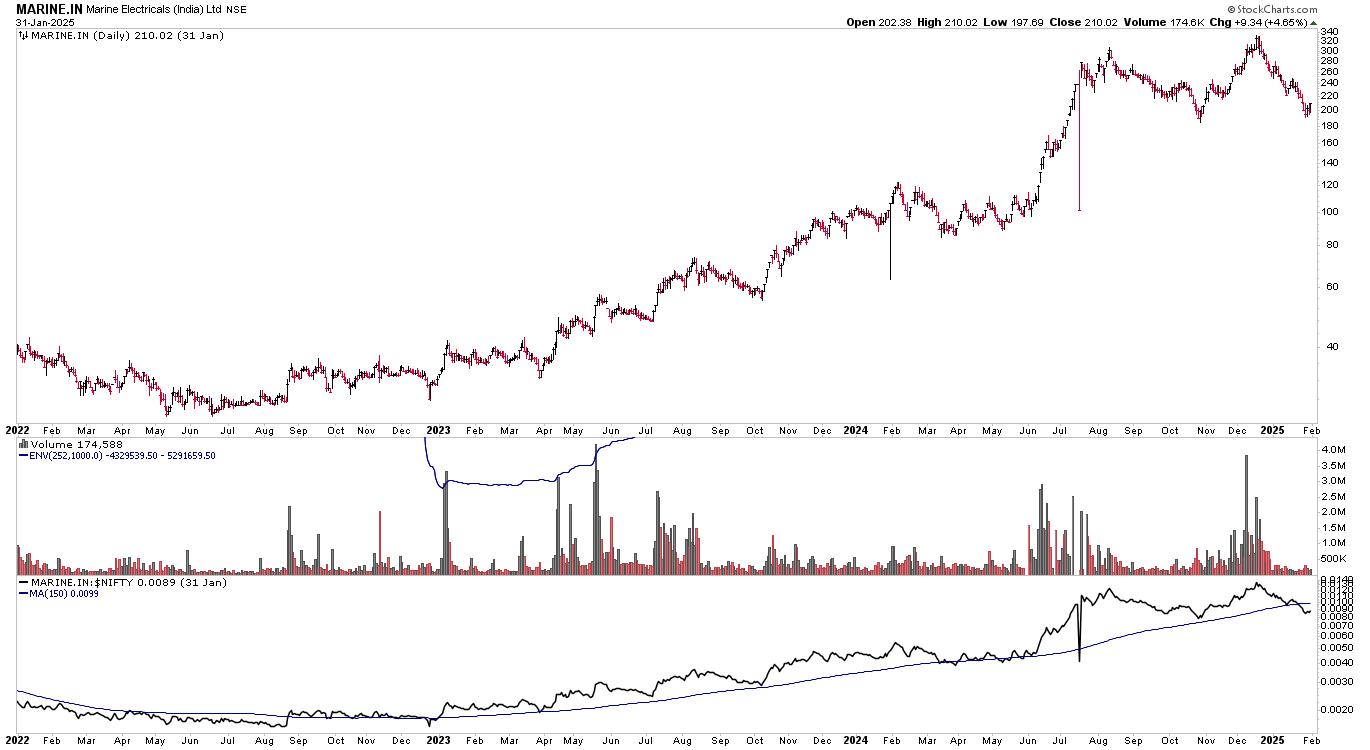
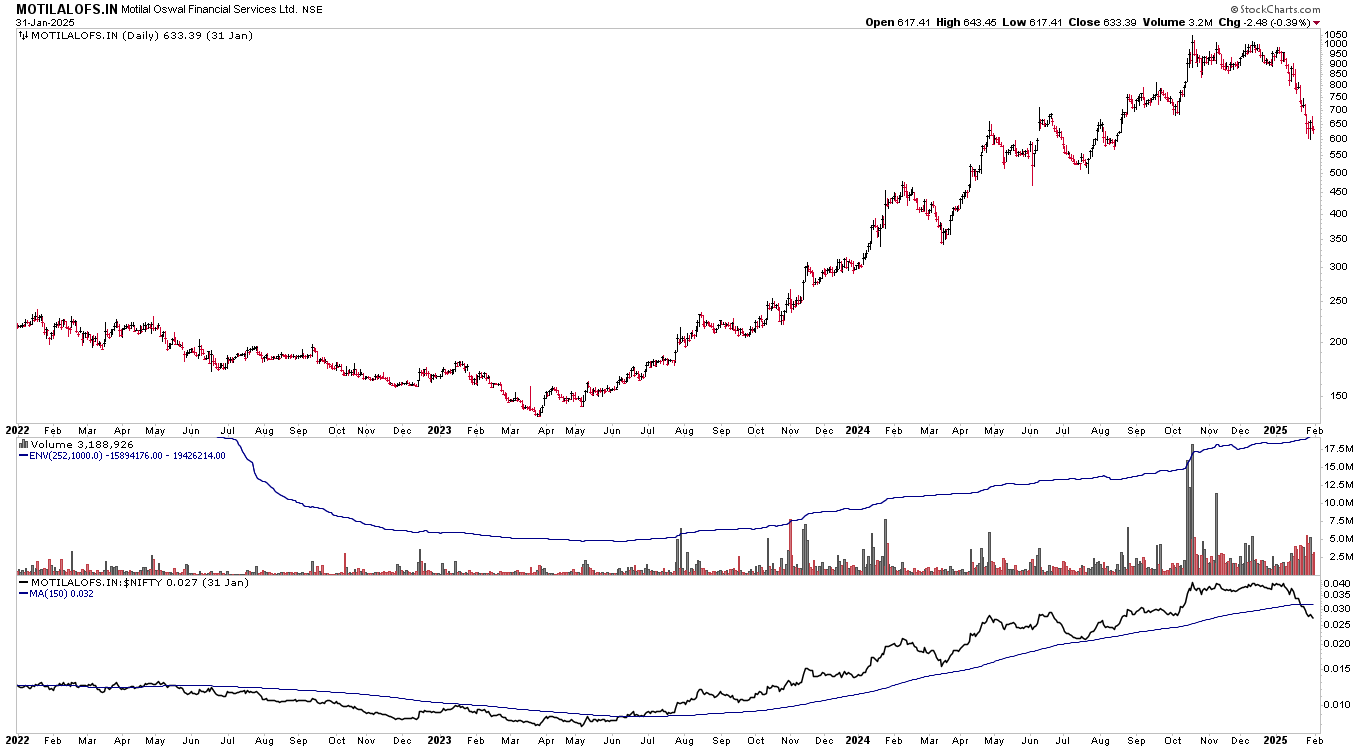
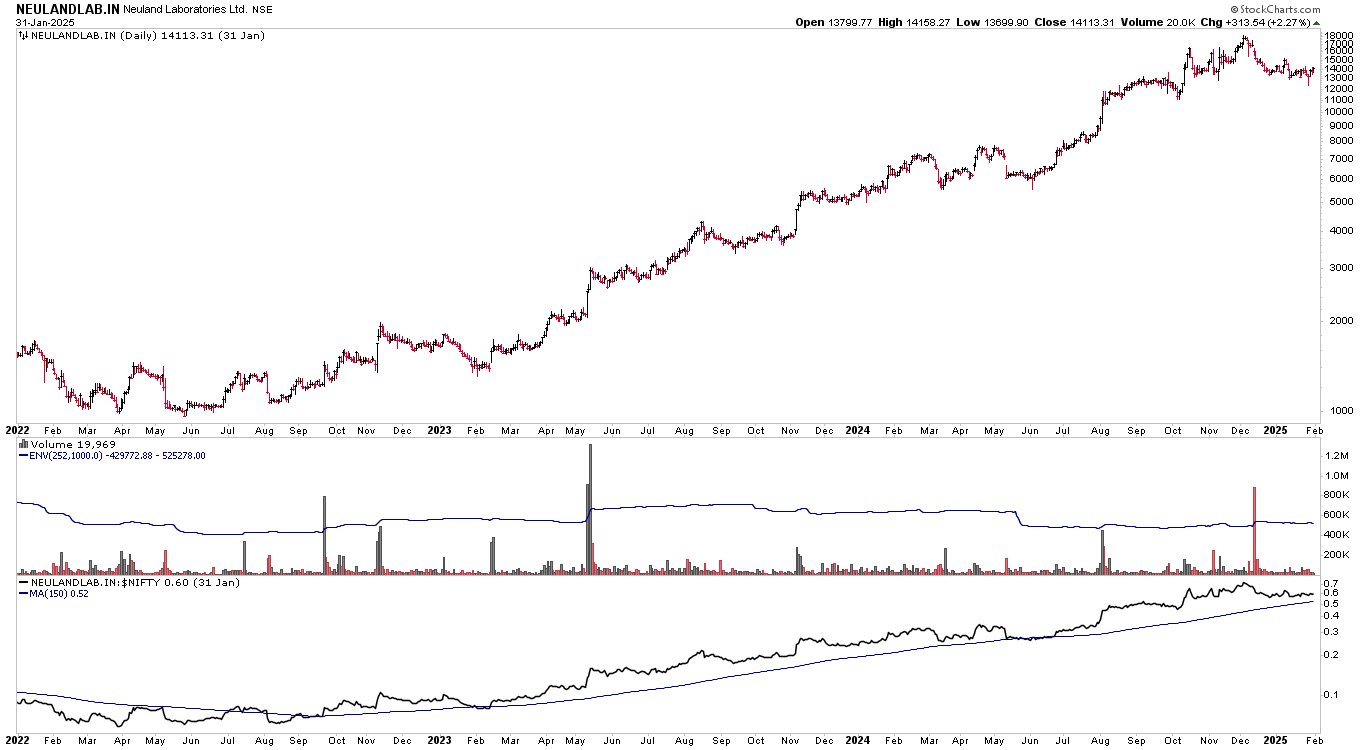
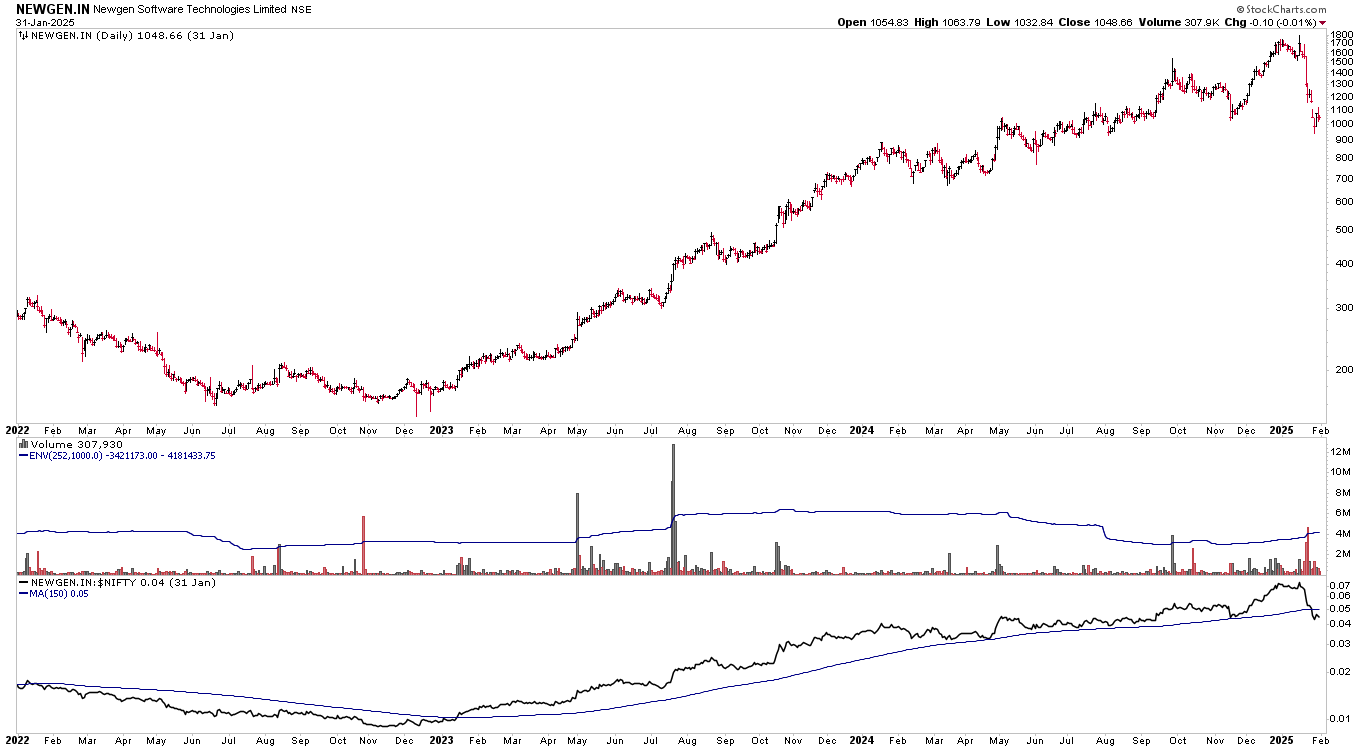
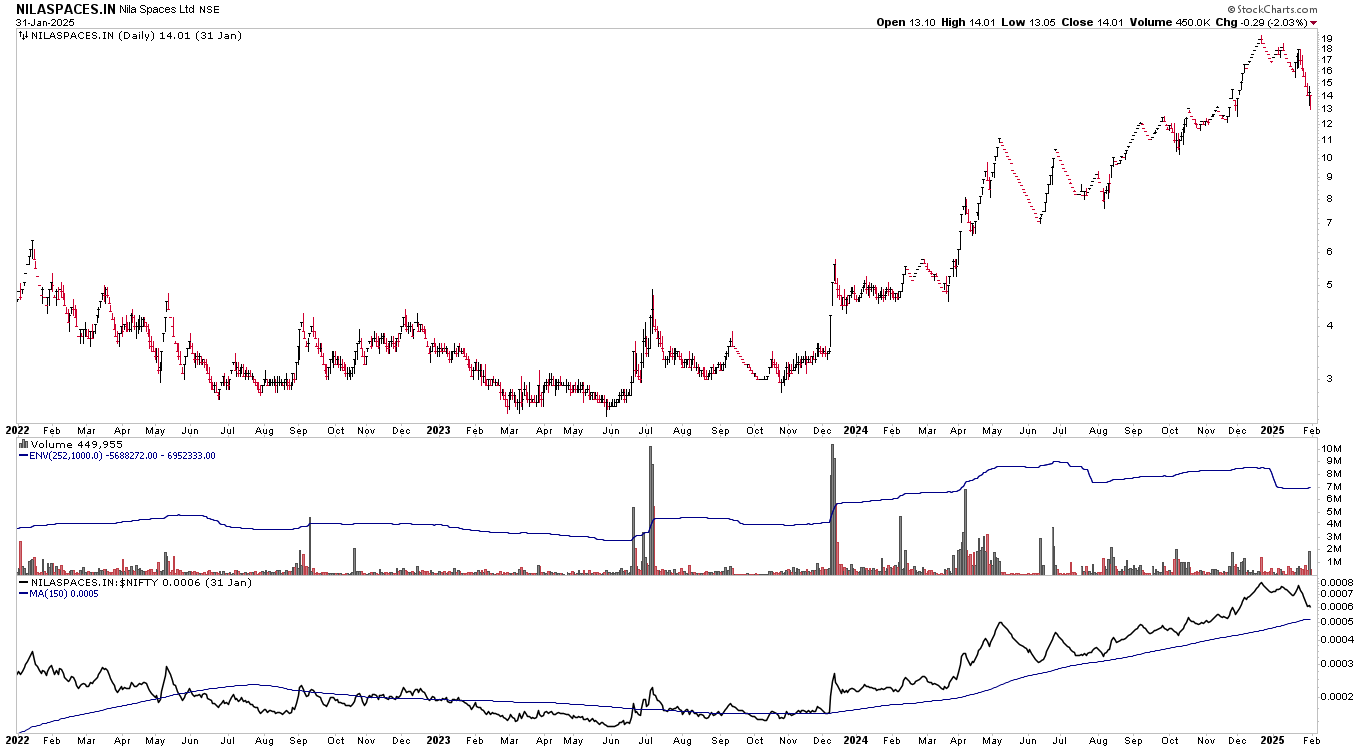
Attached below are a couple of more examples of market leaders from the 2022-2024 cycle. I have not marked these up so you can identify and make your own conclusions.
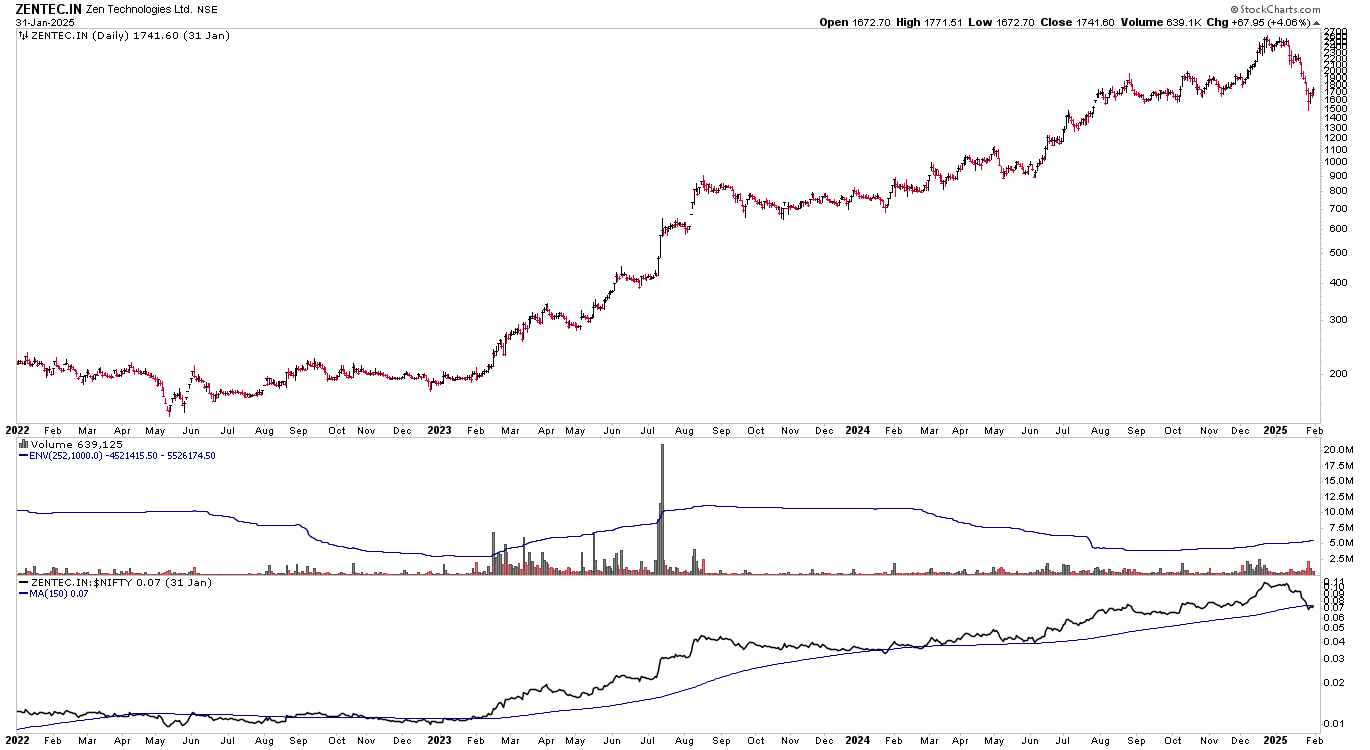
Once again, the blue band on the Volume pane indicates 10 times the average volume of the last 252 days. And the blue moving average on the Ratio Chart pane is the 150 day Simple Moving Average of the ratio between the stock and index.