Quarterly Charts for Speculating in Stocks

Charting serves as a vital tool for speculation by providing a visual record of market psychology, allowing a speculator to identify the trend and time entries with precision. Rather than predicting the future, it acts as a navigational map that helps the speculator manage risk by pinpointing exactly where a price trend has changed or failed.
Despite its utility, charting carries a "bad rap" because it lacks the valuation-based logic of traditional finance, leading critics to view it as a pseudoscience that relies on subjective patterns rather than a company's actual earnings or economic reality. Furthermore, its reputation is often tarnished by retail traders who use it as a speculative shortcut, mistakenly treating historical price lines as guaranteed predictions rather than statistical probabilities.
On one hand we have legends like Jesse Livermore, Paul Tudor Joes, Ed Seykota, Nicholas Darvas, William O'Neil, Stan Weinstein, Victor Sperandeo, Richard Wycoff, W.D. Gann and a countless more who have openly spoken in favor of charting.
On the other hand, we have fundamental purists and a great investor like Warren Buffet who have publicly expressed their disdain for charting.
"I realized technical analysis didn't work when I turned the charts upside down and didn't get a different answer."
In a broad sense, Buffet's dismissal is valid. Fundamentals are what drive stock prices in the long run, and Buffet compared active trading based on charts to "pulling up seedlings every day to check if the roots are growing". He believes that true wealth is created by compounding over decades, and that watching short term price "wiggles" on a chart only serves to distract and tempt investors into making emotional mistakes.
Also, charts do come with the danger of "Seeing What You Want to See". An average person reads charts through the lens of their own bias. Even Livermore argued that "reading" a chart requires a cold, clinical lack of emotion—something most humans struggle with. Despite this, he thought they were an important part of the speculator's toolkit.
"Charts are a tool. They are to the speculator what a compass is to a mariner. They don’t tell you where you’re going, but they tell you where you are and where you’ve been."
Longer Term Charts As The Primary Tool
While the debate of whether or not charts "work" has been going on for debates, my studies show that it not a question of "if" they work but, instead, of "how" you use them.
You see, most charting education focuses on the Daily timeframe, i.e., each bar represents one day of price activity. People learn set "patterns" and then try to predict what the market will do next. What's worse is that they fall into the trap of going to even smaller timeframes like the intraday timeframe with the hopes of "getting rich quick".
I'm not one to comment on day trading myself as I have no experience with it, but the data is clear and it is that over 95% of the people lose their money gambling in the markets.
No wonder charting has a bad rap!
My studies show that charts can be extremely useful if used on longer timeframes to identify and position oneself Ito multi-year trends.
Diving deeper into my research, I came to realize that very few people talk about the Quarterly charts and how they can help speculator's hold onto massive price moves.
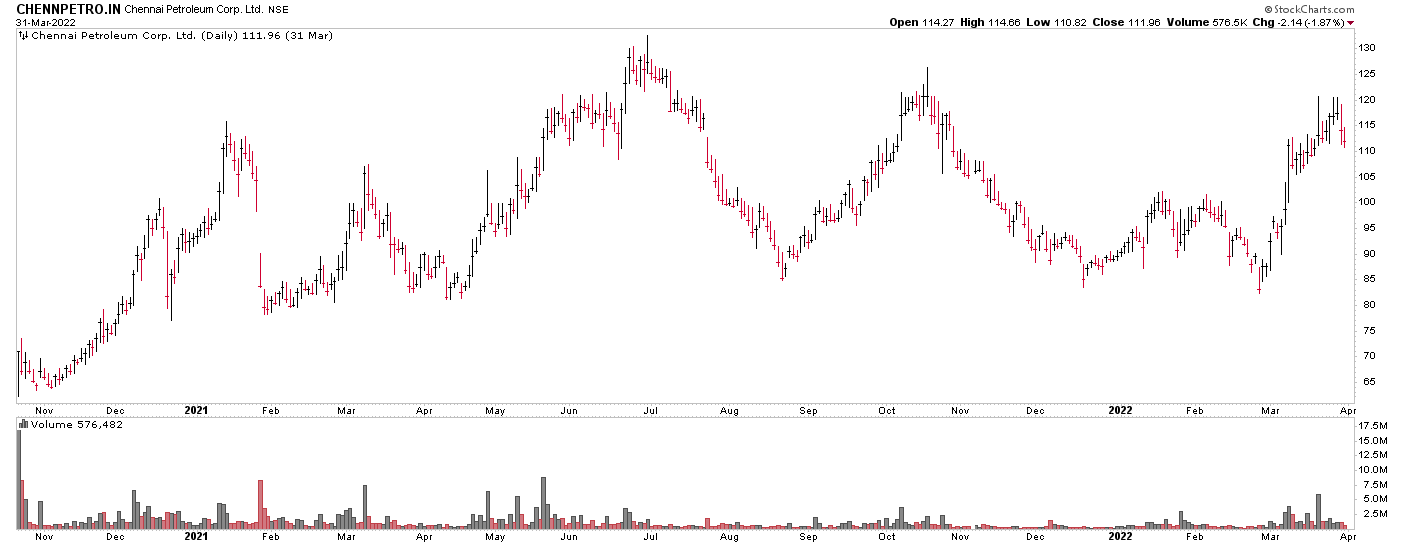
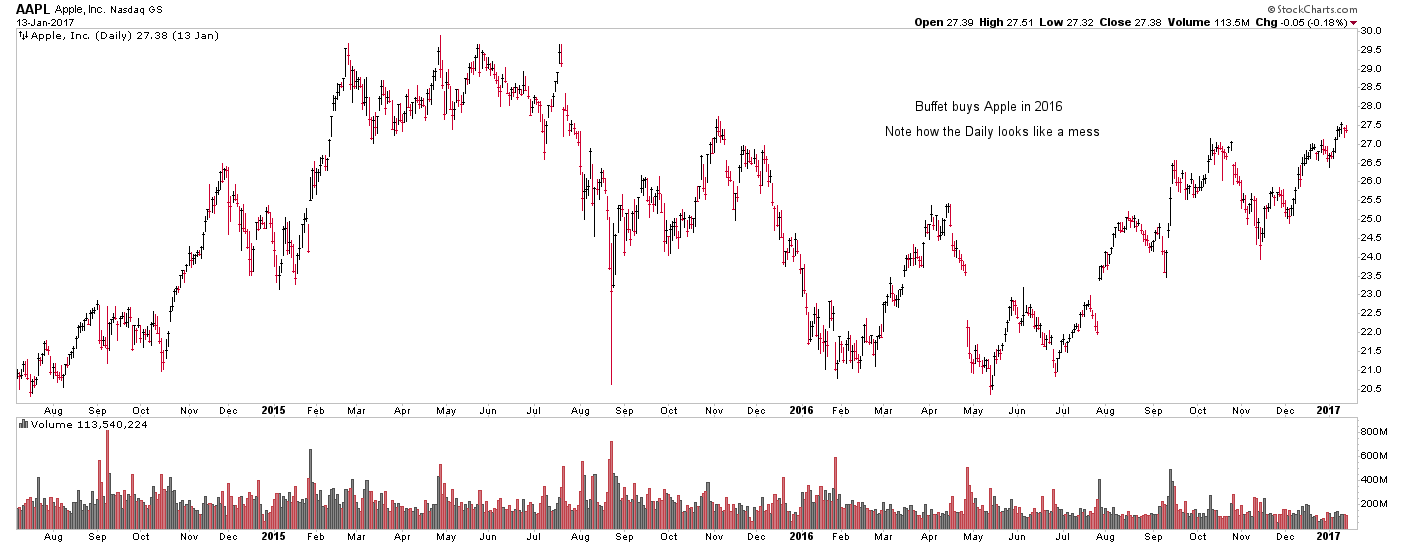
Let's take an example. Watch how "choppy" and trend-less the Daily timeframe chart below looks;
Now, let's go a timeframe higher and see how the same range looks like on a Weekly timeframe chart;
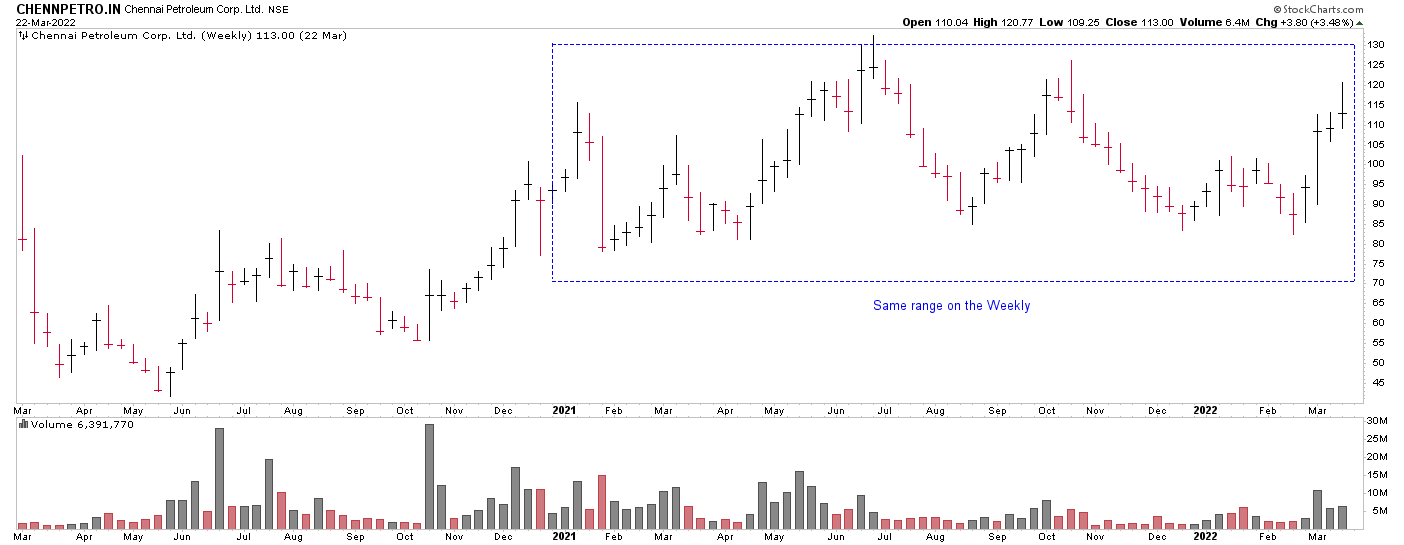
A lot less noise, and a lot more structure already. Let's move to the Monthly now;
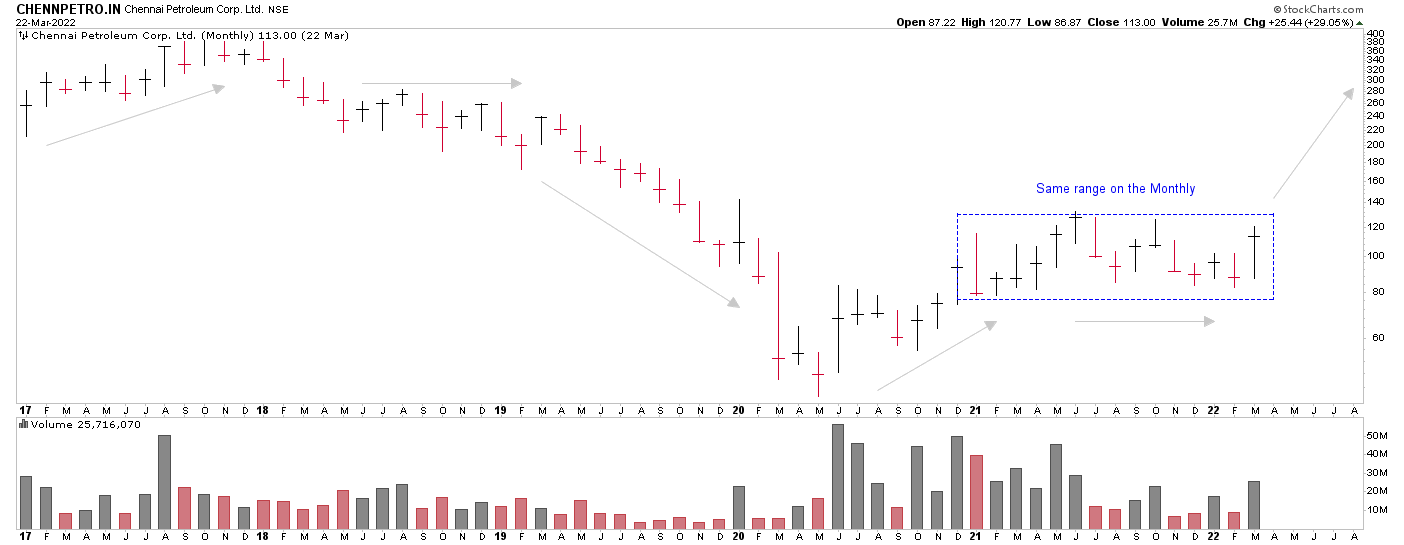
No gaps, no chop, just smooth linear price action. Big moves take time to form and the Monthly timeframe helps put a 12 - 18 month consolidation phase into perspective. Now let's move to the Quarterly;
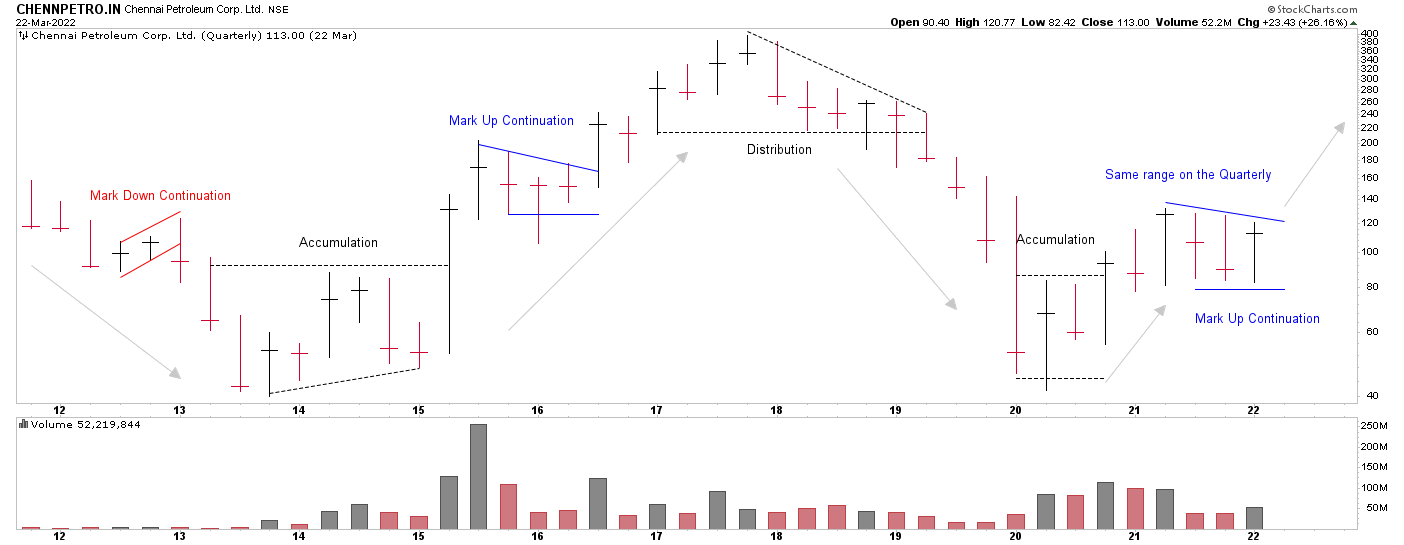
And voila! There it is. A simple picture helping you analyze where you stand in the cycle. Yes, the Quarterly chart cannot be used on newer issues with less data. And no, you don't necessarily need to execute based on quarterly closes (which could work too, as long as you have positive expectancy).
The point here is to note how the higher timeframe helps build context.
One can argue that the daily or weekly could show the same data if the bars were zoomed out and squeezed to fit in 10 years of data, but at that point, you'd be better off using a line chart.
Let me show you how this plays out using Buffet's own APPLE trade from 2016 as an example.
Buffet's Apple Trade Simplified with a Quarterly Chart
Let's begin with the Daily. Sharp correction, range-y and choppy;
Buffet bought this stock in 2016, which later turned to be one of his biggest winners. Here's how the same looked on the Quarterly;
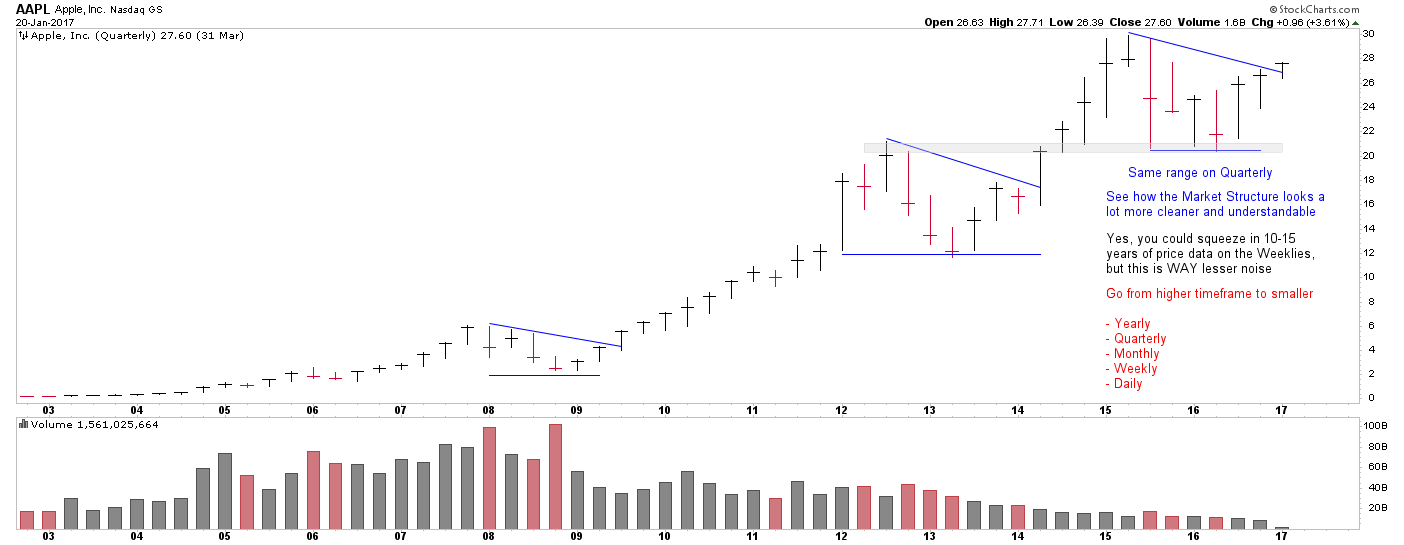
Watch how much more context that Daily chart correction and range get with the Quarterly. Now let's see how the trade played out;
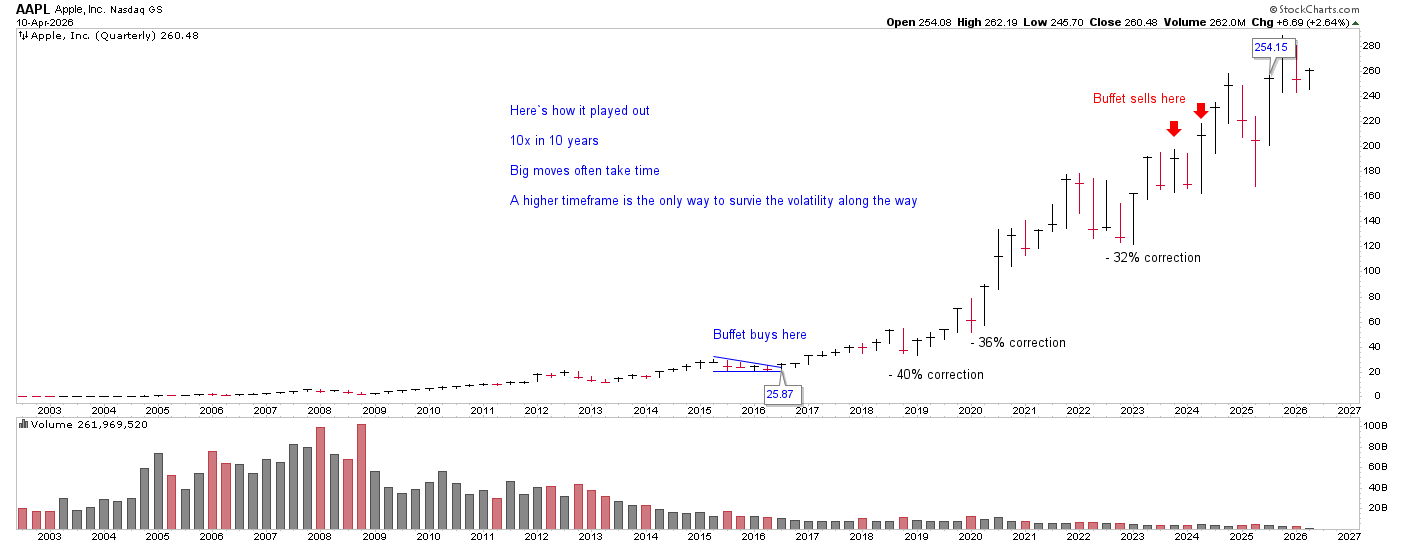
And that's how it's done! Note how there were multiple pullbacks >30% on the way up (and this is a relatively large stable company) which undercut the 200 Day Moving Average and get multiple retail participants trailed out. This is exactly why a larger timeframe along with wide stops and even wider trails is necessary for holding multi year positions.
I hope this shows the point I'm trying to make. If you aspire to catch mega-trends, you need to use a tool that helps you hold on. Quarterly charts are perfect for initial analysis. You can then drop down to lower timeframes to get a more detailed picture; or you'll be missing the forest for the trees.
Once you have understood this, I recommend you read my findings on how Relative Volume can be used to spot Market Leaders.
And lastly, remember that it is earnings that drives price returns in the long run. So unless you're trading turnarounds, it's a given that you need a company that's able to growth its sales and profit consistently and that you are entering at a relatively reasonable valuation multiple; since Price is nothing but P/E x EPS.
I would suggest test this out and do your own research so you can decide for yourself. :)