Buffet's Coca Cola and Apple to Jhunjhunwala's Lupin and Titan: Mega Trends and the 20 Quarter Average

I’m not going to make this a very wordy article as I feel that the point I’m trying to make here is relatively simple.
>> Big moves take time to play out.
>> And big moves shake people out along the way.
If that weren’t the case, everyone would be able to hold on to massive winners.
And I’m talking purely as a long term speculator and not as a shorter term market participant.
Let’s take two of the greatest speculators of our time and their biggest wins.
>> We have Warren Buffet with his investments in Coca Cola and Apple.
>> And then we have Rakesh Jhunjhunwala with his investments in Lupin and Titan.
Different countries, different macro economic factors, different stories;
But what was the same was the fact these are the stocks that turned out to become Mega Trends.
And while Mega Trends have almost everything to do with the MOAT of the company and the quality of management, and very little to do with technicals, as a speculator, and as someone who is in love with charts, I feel it is careless to dismiss technical data completely.
(You can learn more on Mega Trends by listening to talks and presentations by Mr. Utpal Seth; everything he says is gold.)
If I had to sum up the findings in one line, it would be the following.
>> A Mega Trend respects and rides up the 20 Quarter Moving Average with linear price action<<
There. I said it.
Not the daily, not the weekly.
We'll let the charts do the talking.
Down below are the 4 stocks I mentioned; two from Mr. Buffet and two from Mr. Jhunjunwala.
Study them in detail and notice the price action.
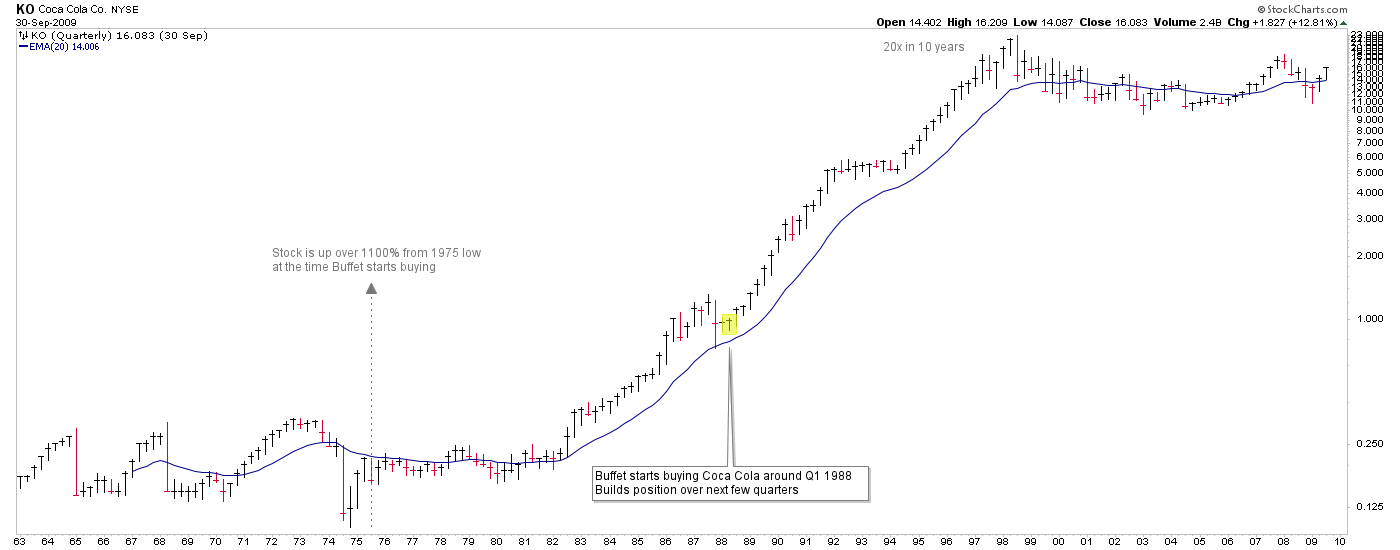
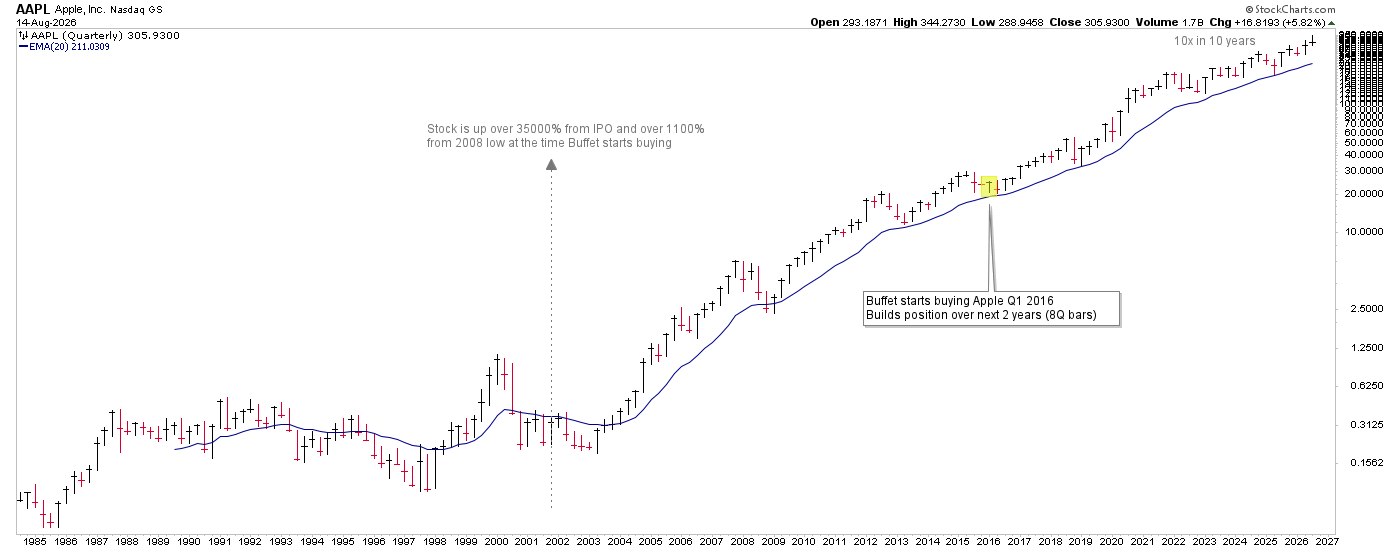
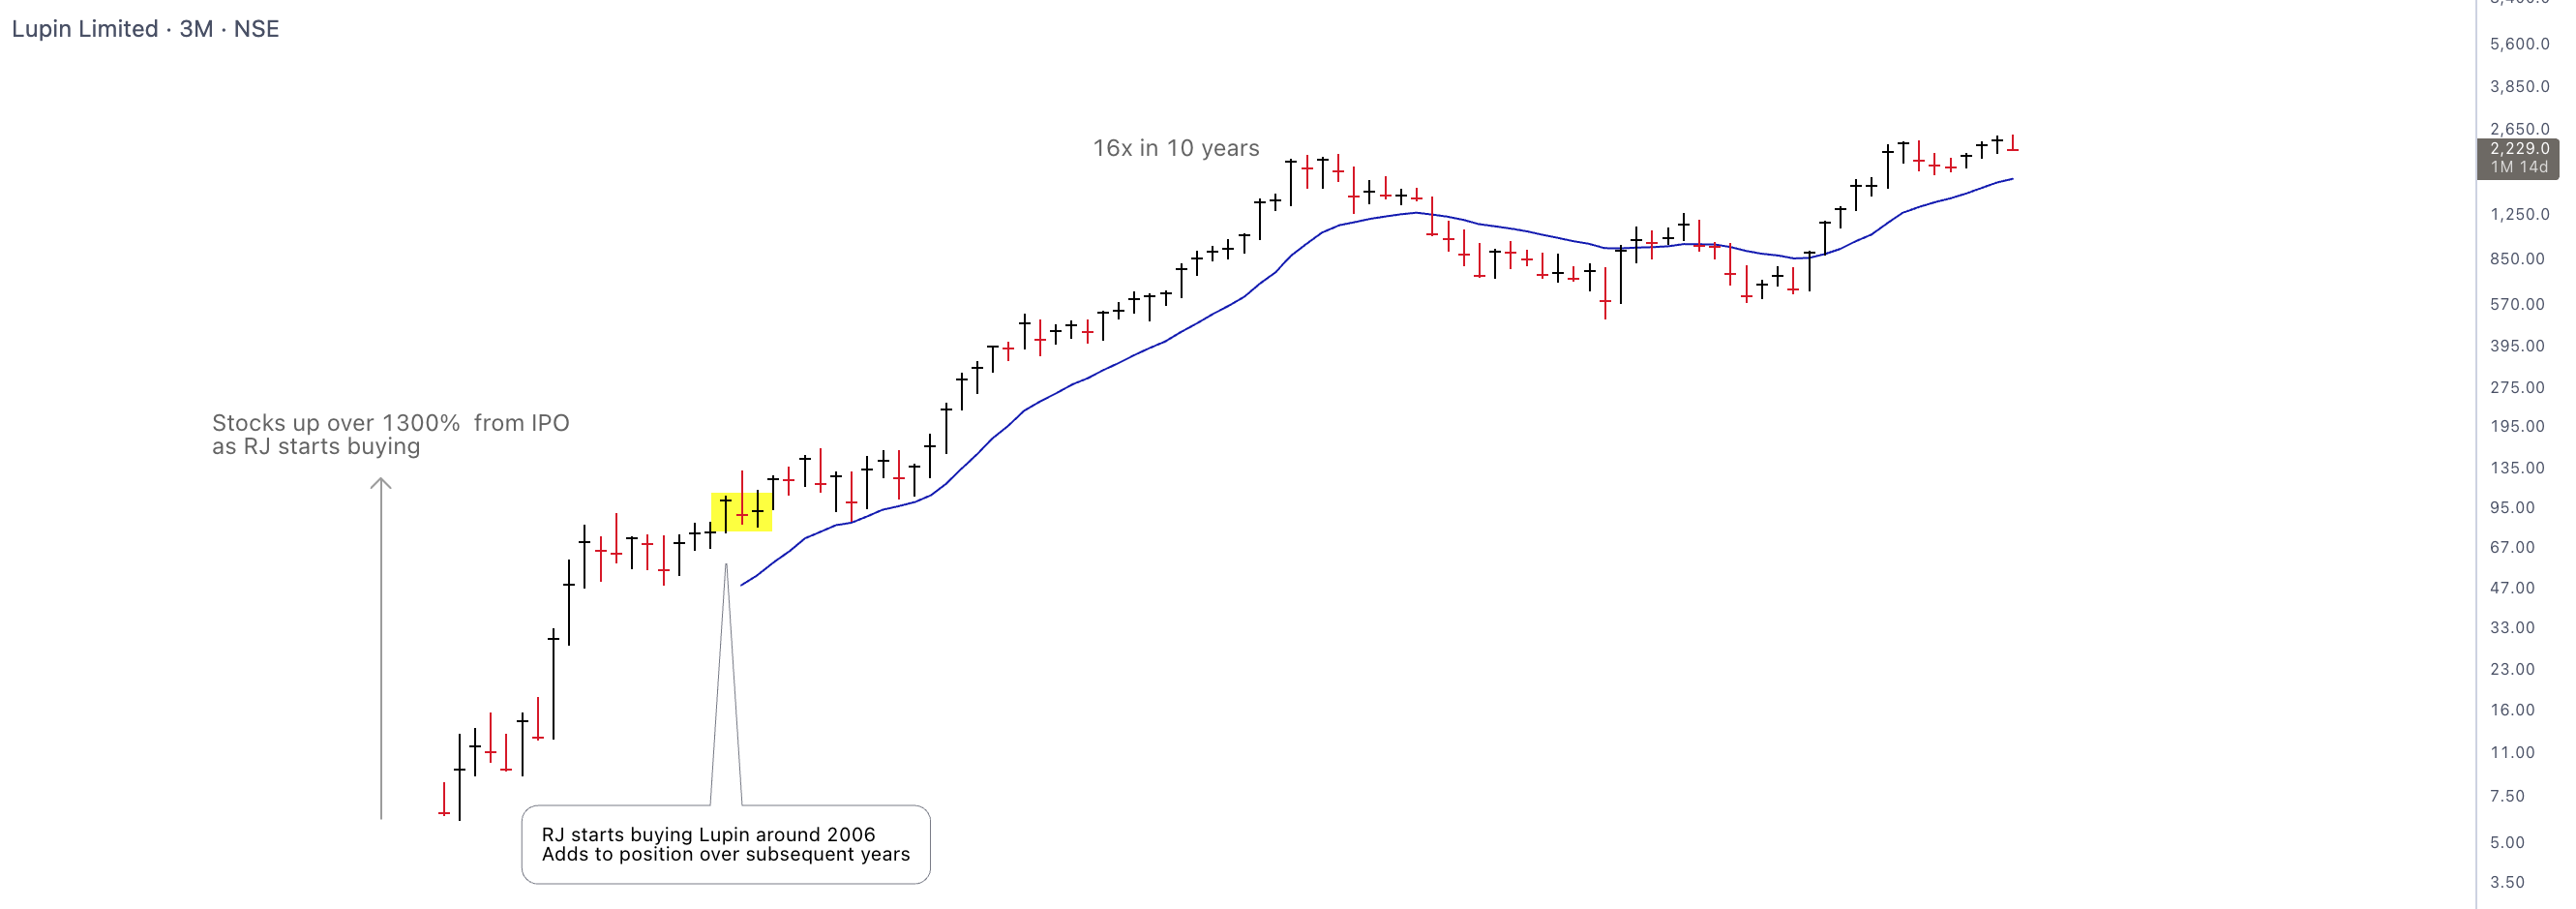
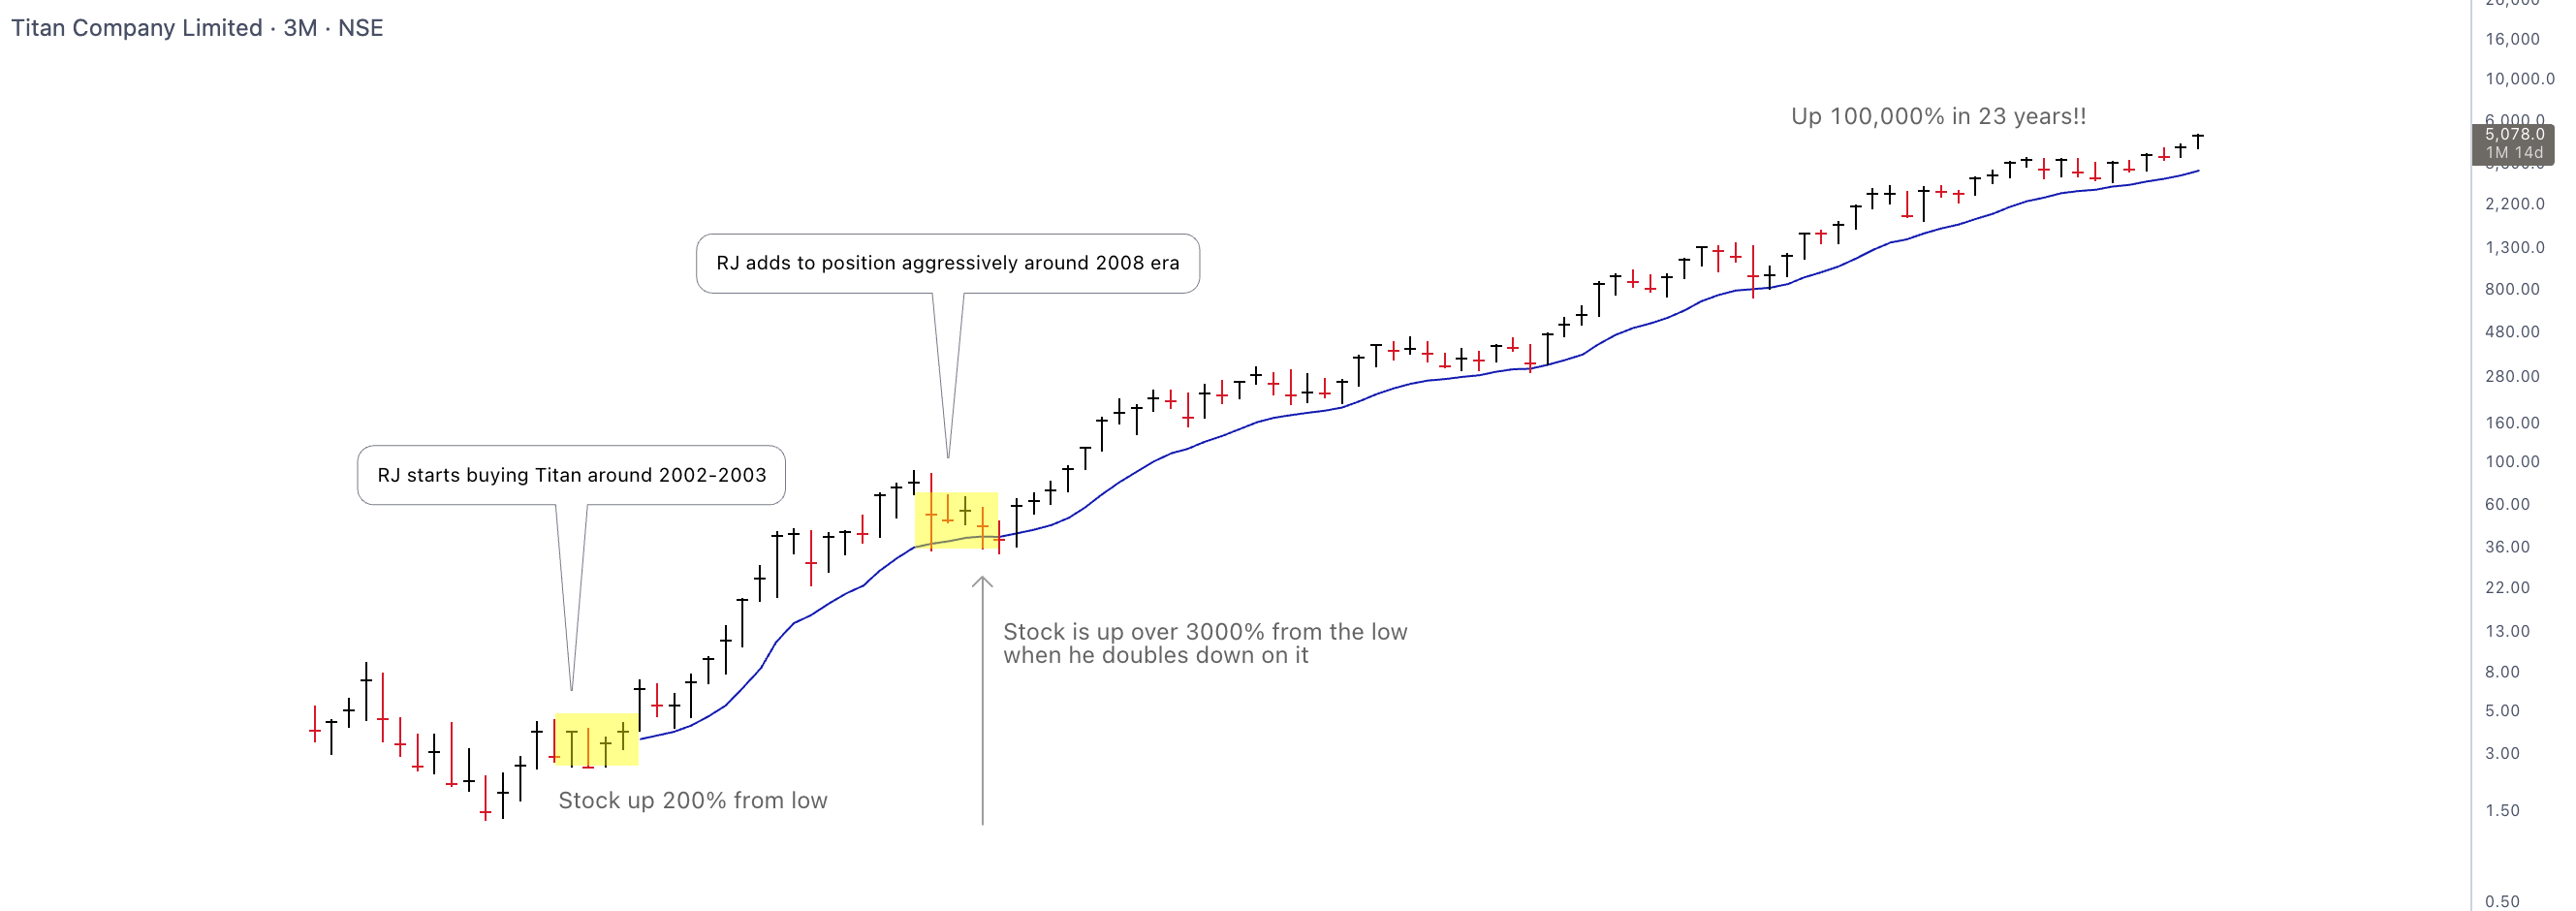
It is safe to say that these mega trends found support at or along their 20 quarter average (around 5 year average).
They were linear in the same way an intra day trader or a swing trader would look for linearity.
Which makes complete sense as price action is fractal in nature and the same relations would hold on the quarterly as they would on the smaller timeframes.
Just that it’s smoother because of higher liquidity and a lack of gap activity.
I have nothing more to add here but I have already mentioned why I think the quarterlies are a timeframe that can’t be ignored in this post here and I hope this serves as a good place for you to start doing your own research.
Volatility and Trends
It is a given that a 20 period average or no other form of technical support is ever a line in the sand.
The greater the volatility, the higher odds of the price undercutting technical levels.
If an asset class or stock consistently holds higher volatility, there are higher odds of it undercutting the 20 quarter average and pulling back to the 50 quarter.
That said, most multi bagger stocks show very few undercuts of the 20 quarter, or at least not very brutal undercuts, and spend most of their time rallying in a linear fashion above it.
Extreme volatility and whipsaw around the 20 quarter indicates that the stock or asset or could cyclical in nature, in which case you would be better off using mean reversion with channels or trendlines to buy turns along the bottom of the cycle.
The simpler trade would be to identify leaders in trend and hopping on.
Hope this helps. Test it out. Thanks for reading. :)
You should also read:
Quarterly Charts for Speculating in Stocks
Charting serves as a vital tool for speculation by providing a visual record of market psychology, allowing a speculator to identify the trend and time entries with precision. Rather than predicting the future, it acts as a navigational map that helps the speculator manage risk…